Italian vs Latvian 2 or more Vehicles in Household
COMPARE
Italian
Latvian
2 or more Vehicles in Household
2 or more Vehicles in Household Comparison
Italians
Latvians
58.4%
2 OR MORE VEHICLES IN HOUSEHOLD
99.6/ 100
METRIC RATING
70th/ 347
METRIC RANK
56.2%
2 OR MORE VEHICLES IN HOUSEHOLD
83.6/ 100
METRIC RATING
140th/ 347
METRIC RANK
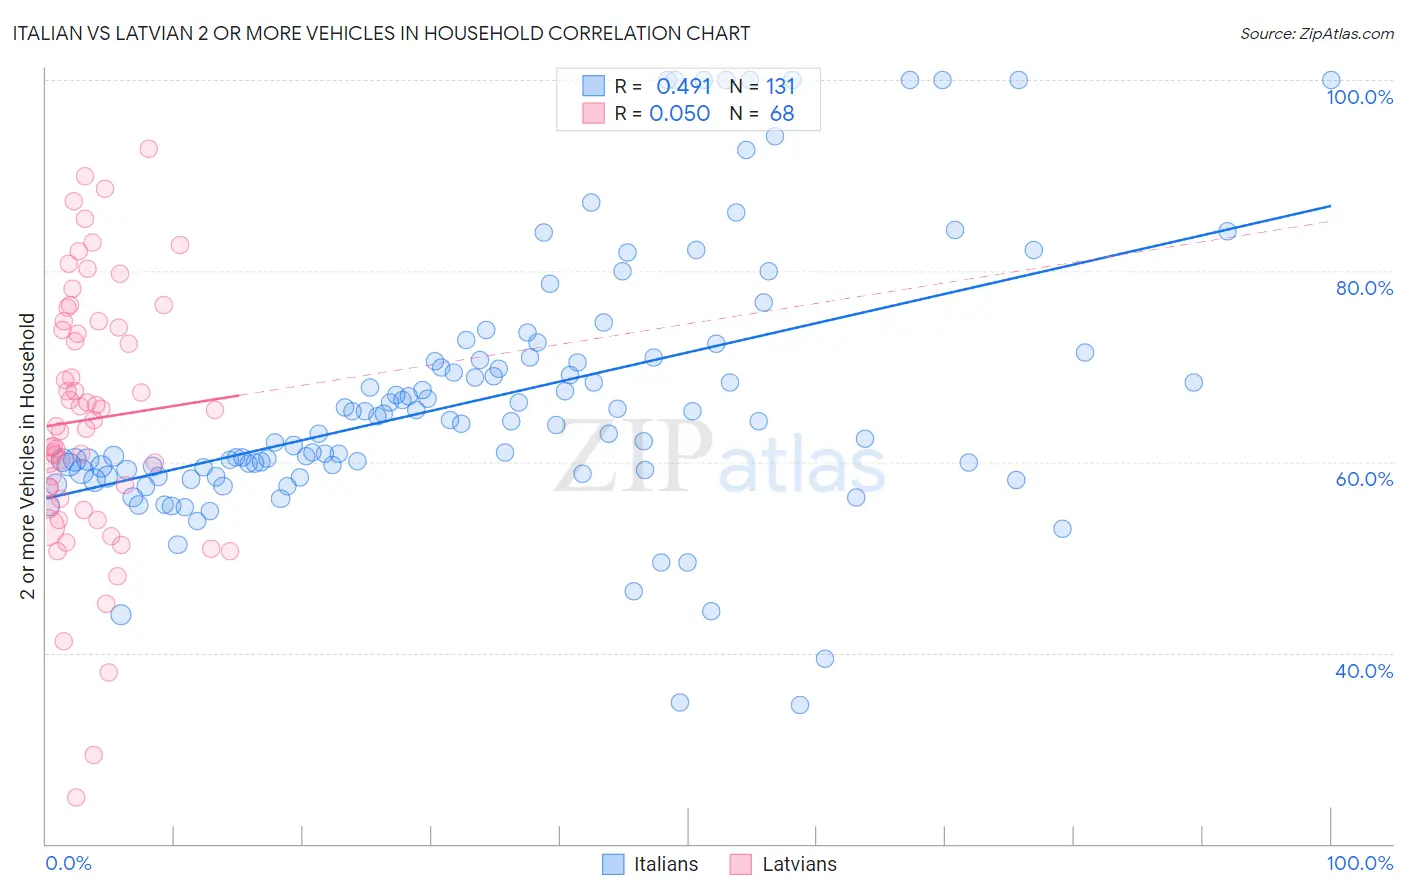
Italian vs Latvian 2 or more Vehicles in Household Correlation Chart
The statistical analysis conducted on geographies consisting of 574,514,486 people shows a moderate positive correlation between the proportion of Italians and percentage of households with 2 or more vehicles available in the United States with a correlation coefficient (R) of 0.491 and weighted average of 58.4%. Similarly, the statistical analysis conducted on geographies consisting of 220,663,993 people shows no correlation between the proportion of Latvians and percentage of households with 2 or more vehicles available in the United States with a correlation coefficient (R) of 0.050 and weighted average of 56.2%, a difference of 3.9%.
2 or more Vehicles in Household Correlation Summary
| Measurement | Italian | Latvian |
| Minimum | 34.5% | 24.9% |
| Maximum | 100.0% | 92.8% |
| Range | 65.5% | 67.9% |
| Mean | 66.7% | 64.5% |
| Median | 64.0% | 64.1% |
| Interquartile 25% (IQ1) | 59.0% | 55.7% |
| Interquartile 75% (IQ3) | 70.9% | 74.4% |
| Interquartile Range (IQR) | 11.9% | 18.7% |
| Standard Deviation (Sample) | 13.8% | 13.8% |
| Standard Deviation (Population) | 13.7% | 13.7% |
Similar Demographics by 2 or more Vehicles in Household
Demographics Similar to Italians by 2 or more Vehicles in Household
In terms of 2 or more vehicles in household, the demographic groups most similar to Italians are Bangladeshi (58.4%, a difference of 0.020%), Austrian (58.4%, a difference of 0.050%), Pennsylvania German (58.5%, a difference of 0.11%), Bolivian (58.3%, a difference of 0.17%), and Immigrants from Afghanistan (58.3%, a difference of 0.18%).
| Demographics | Rating | Rank | 2 or more Vehicles in Household |
| Mexican American Indians | 99.8 /100 | #63 | Exceptional 58.7% |
| Portuguese | 99.7 /100 | #64 | Exceptional 58.6% |
| Immigrants | Central America | 99.7 /100 | #65 | Exceptional 58.6% |
| Croatians | 99.7 /100 | #66 | Exceptional 58.6% |
| Laotians | 99.7 /100 | #67 | Exceptional 58.6% |
| Canadians | 99.7 /100 | #68 | Exceptional 58.6% |
| Pennsylvania Germans | 99.7 /100 | #69 | Exceptional 58.5% |
| Italians | 99.6 /100 | #70 | Exceptional 58.4% |
| Bangladeshis | 99.6 /100 | #71 | Exceptional 58.4% |
| Austrians | 99.6 /100 | #72 | Exceptional 58.4% |
| Bolivians | 99.6 /100 | #73 | Exceptional 58.3% |
| Immigrants | Afghanistan | 99.6 /100 | #74 | Exceptional 58.3% |
| Poles | 99.5 /100 | #75 | Exceptional 58.3% |
| Creek | 99.5 /100 | #76 | Exceptional 58.3% |
| Slovenes | 99.5 /100 | #77 | Exceptional 58.3% |
Demographics Similar to Latvians by 2 or more Vehicles in Household
In terms of 2 or more vehicles in household, the demographic groups most similar to Latvians are Immigrants from Cambodia (56.2%, a difference of 0.0%), South African (56.2%, a difference of 0.040%), Armenian (56.3%, a difference of 0.050%), Salvadoran (56.3%, a difference of 0.080%), and Cuban (56.3%, a difference of 0.090%).
| Demographics | Rating | Rank | 2 or more Vehicles in Household |
| Comanche | 88.4 /100 | #133 | Excellent 56.5% |
| Immigrants | Azores | 86.6 /100 | #134 | Excellent 56.4% |
| Blackfeet | 86.5 /100 | #135 | Excellent 56.4% |
| Immigrants | Asia | 86.0 /100 | #136 | Excellent 56.3% |
| Cubans | 84.8 /100 | #137 | Excellent 56.3% |
| Salvadorans | 84.7 /100 | #138 | Excellent 56.3% |
| Armenians | 84.3 /100 | #139 | Excellent 56.3% |
| Latvians | 83.6 /100 | #140 | Excellent 56.2% |
| Immigrants | Cambodia | 83.6 /100 | #141 | Excellent 56.2% |
| South Africans | 83.1 /100 | #142 | Excellent 56.2% |
| Seminole | 81.7 /100 | #143 | Excellent 56.2% |
| Immigrants | Syria | 81.4 /100 | #144 | Excellent 56.2% |
| Syrians | 81.2 /100 | #145 | Excellent 56.2% |
| Venezuelans | 80.7 /100 | #146 | Excellent 56.1% |
| Serbians | 80.3 /100 | #147 | Excellent 56.1% |