Bulgarian vs Latvian 2 or more Vehicles in Household
COMPARE
Bulgarian
Latvian
2 or more Vehicles in Household
2 or more Vehicles in Household Comparison
Bulgarians
Latvians
56.5%
2 OR MORE VEHICLES IN HOUSEHOLD
89.7/ 100
METRIC RATING
131st/ 347
METRIC RANK
56.2%
2 OR MORE VEHICLES IN HOUSEHOLD
83.6/ 100
METRIC RATING
140th/ 347
METRIC RANK
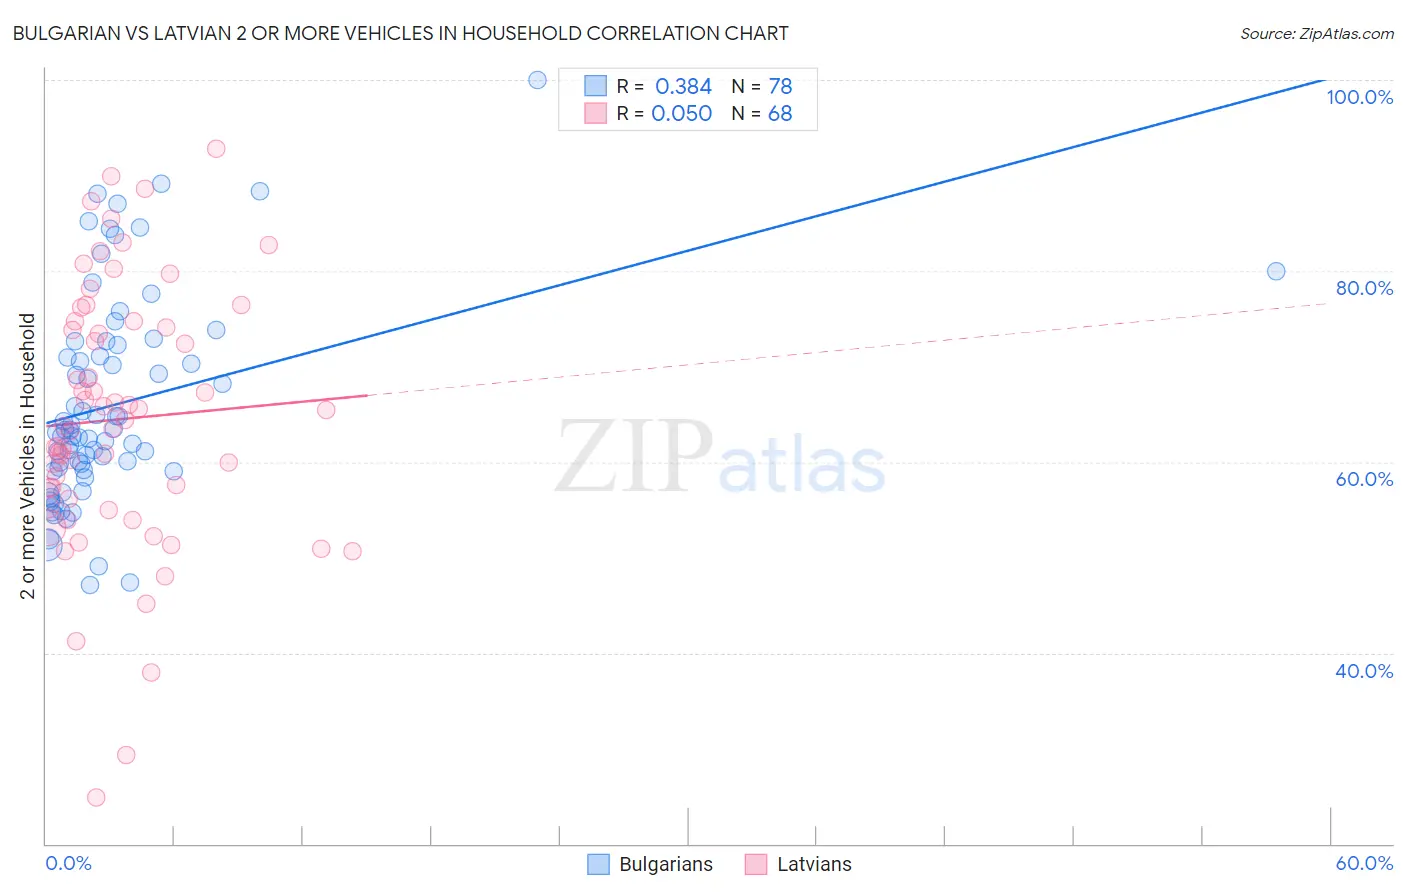
Bulgarian vs Latvian 2 or more Vehicles in Household Correlation Chart
The statistical analysis conducted on geographies consisting of 205,573,622 people shows a mild positive correlation between the proportion of Bulgarians and percentage of households with 2 or more vehicles available in the United States with a correlation coefficient (R) of 0.384 and weighted average of 56.5%. Similarly, the statistical analysis conducted on geographies consisting of 220,663,993 people shows no correlation between the proportion of Latvians and percentage of households with 2 or more vehicles available in the United States with a correlation coefficient (R) of 0.050 and weighted average of 56.2%, a difference of 0.53%.
2 or more Vehicles in Household Correlation Summary
| Measurement | Bulgarian | Latvian |
| Minimum | 47.1% | 24.9% |
| Maximum | 100.0% | 92.8% |
| Range | 52.9% | 67.9% |
| Mean | 66.1% | 64.5% |
| Median | 63.2% | 64.1% |
| Interquartile 25% (IQ1) | 59.1% | 55.7% |
| Interquartile 75% (IQ3) | 72.2% | 74.4% |
| Interquartile Range (IQR) | 13.1% | 18.7% |
| Standard Deviation (Sample) | 10.9% | 13.8% |
| Standard Deviation (Population) | 10.8% | 13.7% |
Demographics Similar to Bulgarians and Latvians by 2 or more Vehicles in Household
In terms of 2 or more vehicles in household, the demographic groups most similar to Bulgarians are Yugoslavian (56.6%, a difference of 0.030%), Hungarian (56.5%, a difference of 0.060%), Ute (56.6%, a difference of 0.070%), Immigrants from South Central Asia (56.6%, a difference of 0.080%), and Immigrants from Thailand (56.6%, a difference of 0.10%). Similarly, the demographic groups most similar to Latvians are Immigrants from Cambodia (56.2%, a difference of 0.0%), South African (56.2%, a difference of 0.040%), Armenian (56.3%, a difference of 0.050%), Salvadoran (56.3%, a difference of 0.080%), and Cuban (56.3%, a difference of 0.090%).
| Demographics | Rating | Rank | 2 or more Vehicles in Household |
| Tsimshian | 91.6 /100 | #125 | Exceptional 56.7% |
| Estonians | 90.9 /100 | #126 | Exceptional 56.6% |
| Immigrants | Thailand | 90.7 /100 | #127 | Exceptional 56.6% |
| Immigrants | South Central Asia | 90.5 /100 | #128 | Exceptional 56.6% |
| Ute | 90.4 /100 | #129 | Exceptional 56.6% |
| Yugoslavians | 90.0 /100 | #130 | Exceptional 56.6% |
| Bulgarians | 89.7 /100 | #131 | Excellent 56.5% |
| Hungarians | 89.1 /100 | #132 | Excellent 56.5% |
| Comanche | 88.4 /100 | #133 | Excellent 56.5% |
| Immigrants | Azores | 86.6 /100 | #134 | Excellent 56.4% |
| Blackfeet | 86.5 /100 | #135 | Excellent 56.4% |
| Immigrants | Asia | 86.0 /100 | #136 | Excellent 56.3% |
| Cubans | 84.8 /100 | #137 | Excellent 56.3% |
| Salvadorans | 84.7 /100 | #138 | Excellent 56.3% |
| Armenians | 84.3 /100 | #139 | Excellent 56.3% |
| Latvians | 83.6 /100 | #140 | Excellent 56.2% |
| Immigrants | Cambodia | 83.6 /100 | #141 | Excellent 56.2% |
| South Africans | 83.1 /100 | #142 | Excellent 56.2% |
| Seminole | 81.7 /100 | #143 | Excellent 56.2% |
| Immigrants | Syria | 81.4 /100 | #144 | Excellent 56.2% |
| Syrians | 81.2 /100 | #145 | Excellent 56.2% |