Okinawan vs Immigrants from Israel No Vehicles in Household
COMPARE
Okinawan
Immigrants from Israel
No Vehicles in Household
No Vehicles in Household Comparison
Okinawans
Immigrants from Israel
14.1%
NO VEHICLES IN HOUSEHOLD
0.0/ 100
METRIC RATING
291st/ 347
METRIC RANK
15.6%
NO VEHICLES IN HOUSEHOLD
0.0/ 100
METRIC RATING
311th/ 347
METRIC RANK
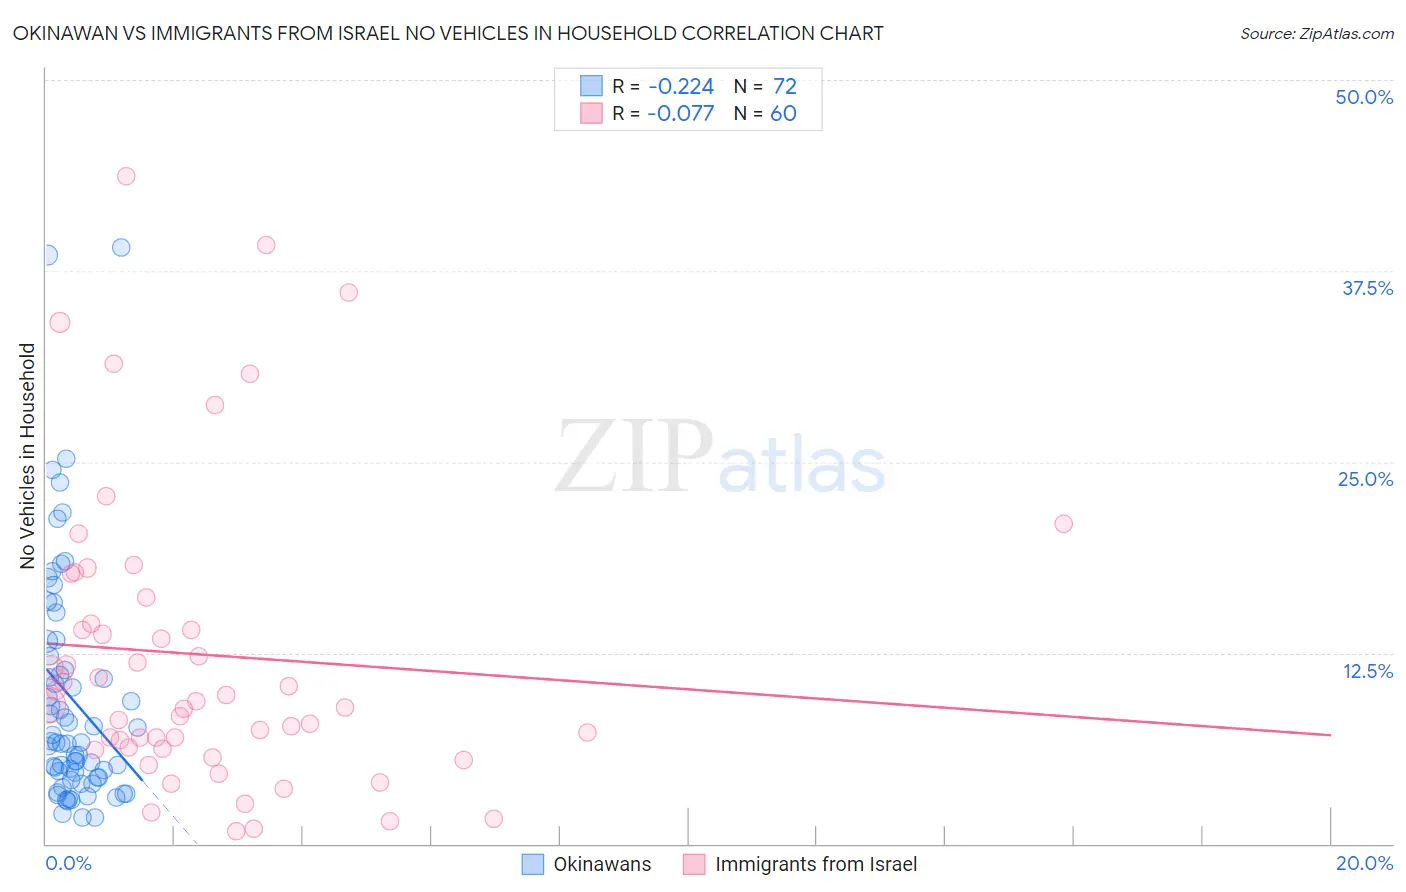
Okinawan vs Immigrants from Israel No Vehicles in Household Correlation Chart
The statistical analysis conducted on geographies consisting of 73,650,004 people shows a weak negative correlation between the proportion of Okinawans and percentage of households with no vehicle available in the United States with a correlation coefficient (R) of -0.224 and weighted average of 14.1%. Similarly, the statistical analysis conducted on geographies consisting of 209,834,938 people shows a slight negative correlation between the proportion of Immigrants from Israel and percentage of households with no vehicle available in the United States with a correlation coefficient (R) of -0.077 and weighted average of 15.6%, a difference of 10.7%.
No Vehicles in Household Correlation Summary
| Measurement | Okinawan | Immigrants from Israel |
| Minimum | 1.7% | 0.81% |
| Maximum | 39.1% | 43.7% |
| Range | 37.3% | 42.9% |
| Mean | 9.5% | 12.4% |
| Median | 6.6% | 9.2% |
| Interquartile 25% (IQ1) | 4.3% | 6.3% |
| Interquartile 75% (IQ3) | 11.9% | 15.3% |
| Interquartile Range (IQR) | 7.5% | 9.0% |
| Standard Deviation (Sample) | 7.7% | 9.8% |
| Standard Deviation (Population) | 7.7% | 9.7% |
Demographics Similar to Okinawans and Immigrants from Israel by No Vehicles in Household
In terms of no vehicles in household, the demographic groups most similar to Okinawans are Pima (14.1%, a difference of 0.48%), Immigrants from Jamaica (14.2%, a difference of 1.1%), Belizean (14.3%, a difference of 1.9%), Paraguayan (14.4%, a difference of 2.1%), and Immigrants from Spain (14.5%, a difference of 3.4%). Similarly, the demographic groups most similar to Immigrants from Israel are Cape Verdean (15.6%, a difference of 0.010%), Puerto Rican (15.5%, a difference of 0.57%), U.S. Virgin Islander (15.4%, a difference of 1.2%), Immigrants from Haiti (15.4%, a difference of 1.3%), and Immigrants from Belize (15.4%, a difference of 1.4%).
| Demographics | Rating | Rank | No Vehicles in Household |
| Okinawans | 0.0 /100 | #291 | Tragic 14.1% |
| Pima | 0.0 /100 | #292 | Tragic 14.1% |
| Immigrants | Jamaica | 0.0 /100 | #293 | Tragic 14.2% |
| Belizeans | 0.0 /100 | #294 | Tragic 14.3% |
| Paraguayans | 0.0 /100 | #295 | Tragic 14.4% |
| Immigrants | Spain | 0.0 /100 | #296 | Tragic 14.5% |
| Immigrants | Panama | 0.0 /100 | #297 | Tragic 14.6% |
| Moroccans | 0.0 /100 | #298 | Tragic 14.7% |
| Immigrants | Greece | 0.0 /100 | #299 | Tragic 14.7% |
| Yuman | 0.0 /100 | #300 | Tragic 14.9% |
| Immigrants | Ukraine | 0.0 /100 | #301 | Tragic 14.9% |
| Haitians | 0.0 /100 | #302 | Tragic 14.9% |
| Immigrants | Western Africa | 0.0 /100 | #303 | Tragic 15.0% |
| Immigrants | Russia | 0.0 /100 | #304 | Tragic 15.1% |
| Immigrants | China | 0.0 /100 | #305 | Tragic 15.2% |
| Immigrants | Belize | 0.0 /100 | #306 | Tragic 15.4% |
| Immigrants | Haiti | 0.0 /100 | #307 | Tragic 15.4% |
| U.S. Virgin Islanders | 0.0 /100 | #308 | Tragic 15.4% |
| Puerto Ricans | 0.0 /100 | #309 | Tragic 15.5% |
| Cape Verdeans | 0.0 /100 | #310 | Tragic 15.6% |
| Immigrants | Israel | 0.0 /100 | #311 | Tragic 15.6% |