Immigrants from Western Africa vs Immigrants from Zimbabwe No Vehicles in Household
COMPARE
Immigrants from Western Africa
Immigrants from Zimbabwe
No Vehicles in Household
No Vehicles in Household Comparison
Immigrants from Western Africa
Immigrants from Zimbabwe
15.0%
NO VEHICLES IN HOUSEHOLD
0.0/ 100
METRIC RATING
303rd/ 347
METRIC RANK
9.9%
NO VEHICLES IN HOUSEHOLD
82.6/ 100
METRIC RATING
142nd/ 347
METRIC RANK
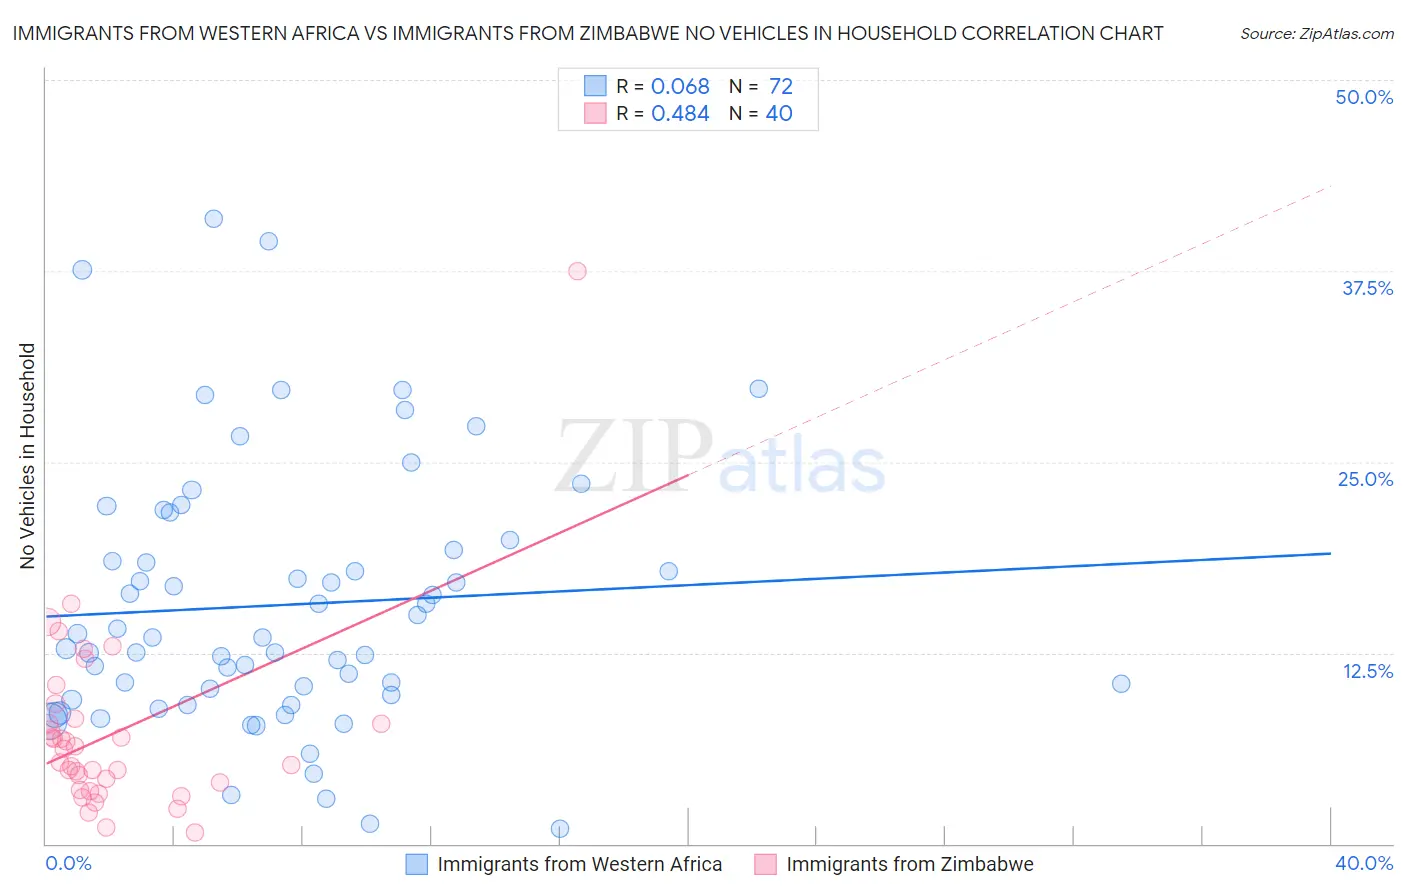
Immigrants from Western Africa vs Immigrants from Zimbabwe No Vehicles in Household Correlation Chart
The statistical analysis conducted on geographies consisting of 356,981,252 people shows a slight positive correlation between the proportion of Immigrants from Western Africa and percentage of households with no vehicle available in the United States with a correlation coefficient (R) of 0.068 and weighted average of 15.0%. Similarly, the statistical analysis conducted on geographies consisting of 117,693,810 people shows a moderate positive correlation between the proportion of Immigrants from Zimbabwe and percentage of households with no vehicle available in the United States with a correlation coefficient (R) of 0.484 and weighted average of 9.9%, a difference of 52.2%.
No Vehicles in Household Correlation Summary
| Measurement | Immigrants from Western Africa | Immigrants from Zimbabwe |
| Minimum | 1.0% | 0.74% |
| Maximum | 40.9% | 37.5% |
| Range | 39.9% | 36.8% |
| Mean | 15.6% | 7.2% |
| Median | 13.5% | 5.8% |
| Interquartile 25% (IQ1) | 9.6% | 3.8% |
| Interquartile 75% (IQ3) | 19.6% | 8.0% |
| Interquartile Range (IQR) | 10.0% | 4.2% |
| Standard Deviation (Sample) | 8.6% | 6.2% |
| Standard Deviation (Population) | 8.5% | 6.1% |
Similar Demographics by No Vehicles in Household
Demographics Similar to Immigrants from Western Africa by No Vehicles in Household
In terms of no vehicles in household, the demographic groups most similar to Immigrants from Western Africa are Haitian (14.9%, a difference of 0.52%), Immigrants from Russia (15.1%, a difference of 0.66%), Immigrants from Ukraine (14.9%, a difference of 0.99%), Yuman (14.9%, a difference of 1.0%), and Immigrants from China (15.2%, a difference of 1.0%).
| Demographics | Rating | Rank | No Vehicles in Household |
| Immigrants | Spain | 0.0 /100 | #296 | Tragic 14.5% |
| Immigrants | Panama | 0.0 /100 | #297 | Tragic 14.6% |
| Moroccans | 0.0 /100 | #298 | Tragic 14.7% |
| Immigrants | Greece | 0.0 /100 | #299 | Tragic 14.7% |
| Yuman | 0.0 /100 | #300 | Tragic 14.9% |
| Immigrants | Ukraine | 0.0 /100 | #301 | Tragic 14.9% |
| Haitians | 0.0 /100 | #302 | Tragic 14.9% |
| Immigrants | Western Africa | 0.0 /100 | #303 | Tragic 15.0% |
| Immigrants | Russia | 0.0 /100 | #304 | Tragic 15.1% |
| Immigrants | China | 0.0 /100 | #305 | Tragic 15.2% |
| Immigrants | Belize | 0.0 /100 | #306 | Tragic 15.4% |
| Immigrants | Haiti | 0.0 /100 | #307 | Tragic 15.4% |
| U.S. Virgin Islanders | 0.0 /100 | #308 | Tragic 15.4% |
| Puerto Ricans | 0.0 /100 | #309 | Tragic 15.5% |
| Cape Verdeans | 0.0 /100 | #310 | Tragic 15.6% |
Demographics Similar to Immigrants from Zimbabwe by No Vehicles in Household
In terms of no vehicles in household, the demographic groups most similar to Immigrants from Zimbabwe are Sudanese (9.8%, a difference of 0.13%), Immigrants from Lithuania (9.8%, a difference of 0.35%), Chilean (9.9%, a difference of 0.35%), Immigrants from Bahamas (9.9%, a difference of 0.35%), and Marshallese (9.8%, a difference of 0.36%).
| Demographics | Rating | Rank | No Vehicles in Household |
| Latvians | 85.1 /100 | #135 | Excellent 9.8% |
| Immigrants | South Africa | 85.0 /100 | #136 | Excellent 9.8% |
| Immigrants | Moldova | 84.6 /100 | #137 | Excellent 9.8% |
| Estonians | 84.2 /100 | #138 | Excellent 9.8% |
| Marshallese | 84.0 /100 | #139 | Excellent 9.8% |
| Immigrants | Lithuania | 84.0 /100 | #140 | Excellent 9.8% |
| Sudanese | 83.1 /100 | #141 | Excellent 9.8% |
| Immigrants | Zimbabwe | 82.6 /100 | #142 | Excellent 9.9% |
| Chileans | 81.2 /100 | #143 | Excellent 9.9% |
| Immigrants | Bahamas | 81.2 /100 | #144 | Excellent 9.9% |
| Bahamians | 81.0 /100 | #145 | Excellent 9.9% |
| Hungarians | 80.0 /100 | #146 | Excellent 9.9% |
| Immigrants | Nicaragua | 79.8 /100 | #147 | Good 9.9% |
| Immigrants | Bosnia and Herzegovina | 79.1 /100 | #148 | Good 9.9% |
| Immigrants | Uganda | 76.1 /100 | #149 | Good 10.0% |