Costa Rican vs Immigrants from Zimbabwe No Vehicles in Household
COMPARE
Costa Rican
Immigrants from Zimbabwe
No Vehicles in Household
No Vehicles in Household Comparison
Costa Ricans
Immigrants from Zimbabwe
9.5%
NO VEHICLES IN HOUSEHOLD
92.3/ 100
METRIC RATING
122nd/ 347
METRIC RANK
9.9%
NO VEHICLES IN HOUSEHOLD
82.6/ 100
METRIC RATING
142nd/ 347
METRIC RANK
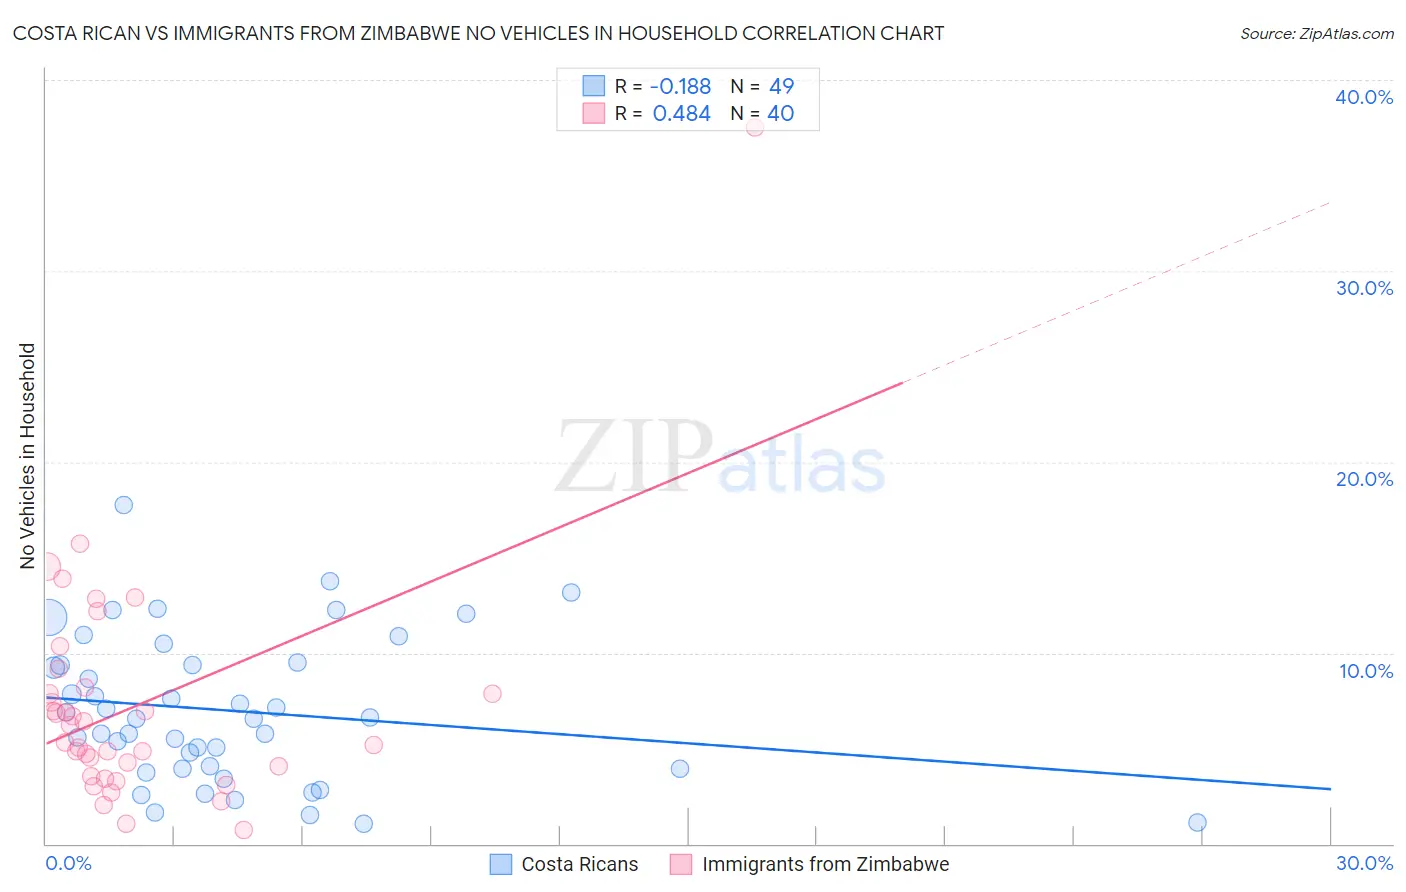
Costa Rican vs Immigrants from Zimbabwe No Vehicles in Household Correlation Chart
The statistical analysis conducted on geographies consisting of 253,314,745 people shows a poor negative correlation between the proportion of Costa Ricans and percentage of households with no vehicle available in the United States with a correlation coefficient (R) of -0.188 and weighted average of 9.5%. Similarly, the statistical analysis conducted on geographies consisting of 117,693,810 people shows a moderate positive correlation between the proportion of Immigrants from Zimbabwe and percentage of households with no vehicle available in the United States with a correlation coefficient (R) of 0.484 and weighted average of 9.9%, a difference of 3.4%.
No Vehicles in Household Correlation Summary
| Measurement | Costa Rican | Immigrants from Zimbabwe |
| Minimum | 1.0% | 0.74% |
| Maximum | 17.8% | 37.5% |
| Range | 16.7% | 36.8% |
| Mean | 7.0% | 7.2% |
| Median | 6.6% | 5.8% |
| Interquartile 25% (IQ1) | 3.9% | 3.8% |
| Interquartile 75% (IQ3) | 9.4% | 8.0% |
| Interquartile Range (IQR) | 5.5% | 4.2% |
| Standard Deviation (Sample) | 3.8% | 6.2% |
| Standard Deviation (Population) | 3.8% | 6.1% |
Demographics Similar to Costa Ricans and Immigrants from Zimbabwe by No Vehicles in Household
In terms of no vehicles in household, the demographic groups most similar to Costa Ricans are Blackfeet (9.6%, a difference of 0.46%), Immigrants from Korea (9.6%, a difference of 0.68%), Immigrants from Cameroon (9.6%, a difference of 0.82%), Icelander (9.6%, a difference of 0.98%), and Immigrants from Kenya (9.6%, a difference of 1.2%). Similarly, the demographic groups most similar to Immigrants from Zimbabwe are Sudanese (9.8%, a difference of 0.13%), Immigrants from Lithuania (9.8%, a difference of 0.35%), Marshallese (9.8%, a difference of 0.36%), Estonian (9.8%, a difference of 0.40%), and Immigrants from Moldova (9.8%, a difference of 0.52%).
| Demographics | Rating | Rank | No Vehicles in Household |
| Costa Ricans | 92.3 /100 | #122 | Exceptional 9.5% |
| Blackfeet | 91.4 /100 | #123 | Exceptional 9.6% |
| Immigrants | Korea | 90.9 /100 | #124 | Exceptional 9.6% |
| Immigrants | Cameroon | 90.6 /100 | #125 | Exceptional 9.6% |
| Icelanders | 90.2 /100 | #126 | Exceptional 9.6% |
| Immigrants | Kenya | 89.7 /100 | #127 | Excellent 9.6% |
| Immigrants | Syria | 89.5 /100 | #128 | Excellent 9.6% |
| Nicaraguans | 89.5 /100 | #129 | Excellent 9.7% |
| Burmese | 88.8 /100 | #130 | Excellent 9.7% |
| Immigrants | Azores | 88.2 /100 | #131 | Excellent 9.7% |
| Kenyans | 88.0 /100 | #132 | Excellent 9.7% |
| Immigrants | Oceania | 87.1 /100 | #133 | Excellent 9.7% |
| Syrians | 87.1 /100 | #134 | Excellent 9.7% |
| Latvians | 85.1 /100 | #135 | Excellent 9.8% |
| Immigrants | South Africa | 85.0 /100 | #136 | Excellent 9.8% |
| Immigrants | Moldova | 84.6 /100 | #137 | Excellent 9.8% |
| Estonians | 84.2 /100 | #138 | Excellent 9.8% |
| Marshallese | 84.0 /100 | #139 | Excellent 9.8% |
| Immigrants | Lithuania | 84.0 /100 | #140 | Excellent 9.8% |
| Sudanese | 83.1 /100 | #141 | Excellent 9.8% |
| Immigrants | Zimbabwe | 82.6 /100 | #142 | Excellent 9.9% |