Okinawan vs Immigrants from Cuba 3 or more Vehicles in Household
COMPARE
Okinawan
Immigrants from Cuba
3 or more Vehicles in Household
3 or more Vehicles in Household Comparison
Okinawans
Immigrants from Cuba
17.4%
3 OR MORE VEHICLES IN HOUSEHOLD
0.4/ 100
METRIC RATING
276th/ 347
METRIC RANK
18.8%
3 OR MORE VEHICLES IN HOUSEHOLD
11.6/ 100
METRIC RATING
213th/ 347
METRIC RANK
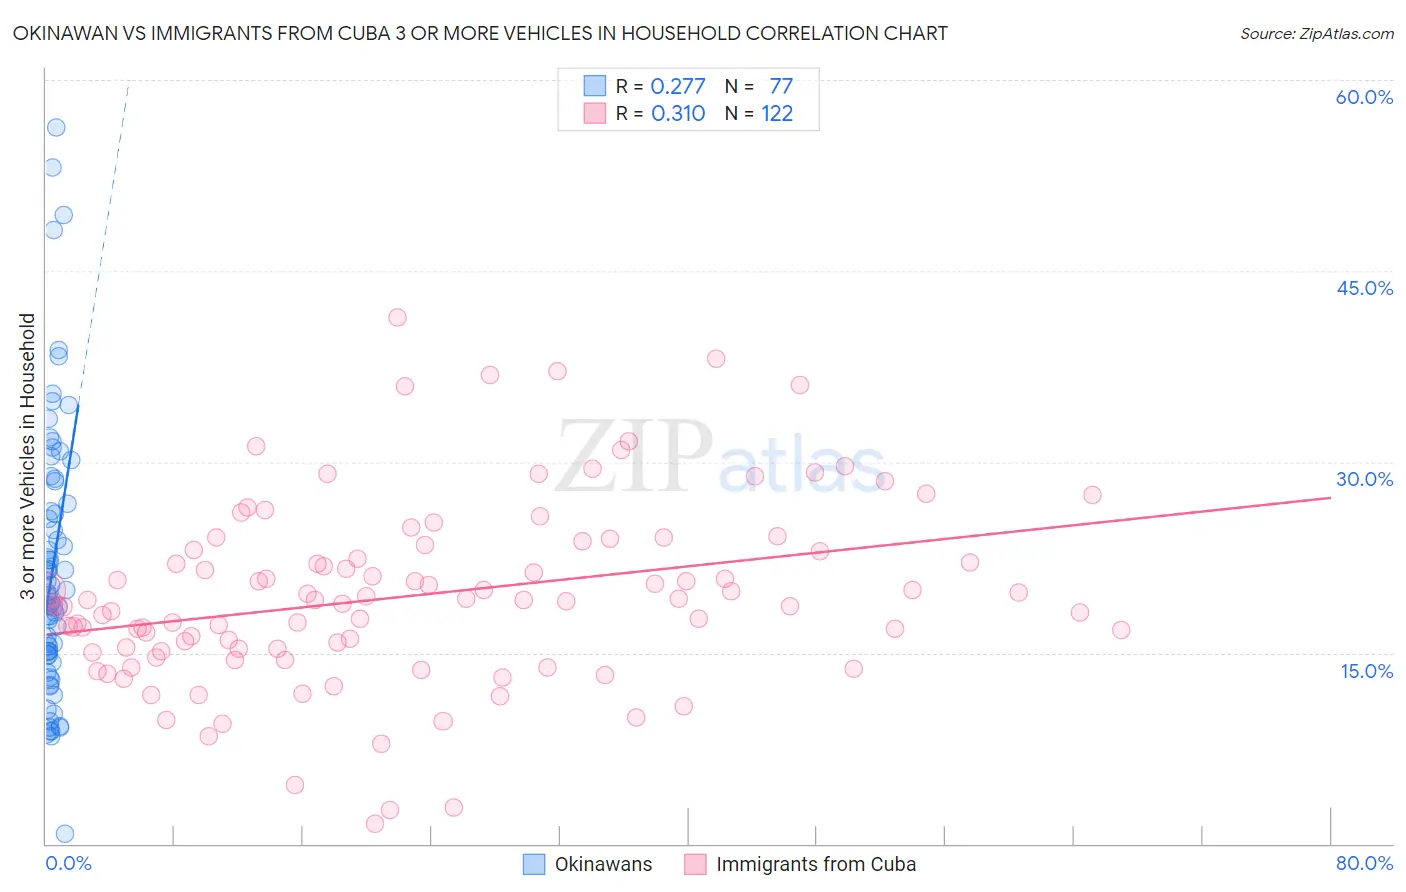
Okinawan vs Immigrants from Cuba 3 or more Vehicles in Household Correlation Chart
The statistical analysis conducted on geographies consisting of 73,703,163 people shows a weak positive correlation between the proportion of Okinawans and percentage of households with 3 or more vehicles available in the United States with a correlation coefficient (R) of 0.277 and weighted average of 17.4%. Similarly, the statistical analysis conducted on geographies consisting of 325,895,387 people shows a mild positive correlation between the proportion of Immigrants from Cuba and percentage of households with 3 or more vehicles available in the United States with a correlation coefficient (R) of 0.310 and weighted average of 18.8%, a difference of 7.5%.
3 or more Vehicles in Household Correlation Summary
| Measurement | Okinawan | Immigrants from Cuba |
| Minimum | 0.75% | 1.6% |
| Maximum | 56.2% | 41.4% |
| Range | 55.5% | 39.8% |
| Mean | 21.7% | 19.5% |
| Median | 19.5% | 19.1% |
| Interquartile 25% (IQ1) | 14.8% | 15.3% |
| Interquartile 75% (IQ3) | 27.6% | 23.1% |
| Interquartile Range (IQR) | 12.8% | 7.8% |
| Standard Deviation (Sample) | 10.7% | 7.3% |
| Standard Deviation (Population) | 10.6% | 7.2% |
Similar Demographics by 3 or more Vehicles in Household
Demographics Similar to Okinawans by 3 or more Vehicles in Household
In terms of 3 or more vehicles in household, the demographic groups most similar to Okinawans are Brazilian (17.4%, a difference of 0.14%), Immigrants from Ukraine (17.5%, a difference of 0.16%), Immigrants from Bahamas (17.4%, a difference of 0.23%), Immigrants from Kazakhstan (17.4%, a difference of 0.25%), and Immigrants from Eastern Europe (17.4%, a difference of 0.29%).
| Demographics | Rating | Rank | 3 or more Vehicles in Household |
| Immigrants | France | 0.6 /100 | #269 | Tragic 17.6% |
| Immigrants | Nepal | 0.6 /100 | #270 | Tragic 17.6% |
| South Americans | 0.6 /100 | #271 | Tragic 17.6% |
| Immigrants | Africa | 0.5 /100 | #272 | Tragic 17.6% |
| Immigrants | Sudan | 0.5 /100 | #273 | Tragic 17.6% |
| Immigrants | Bosnia and Herzegovina | 0.5 /100 | #274 | Tragic 17.5% |
| Immigrants | Ukraine | 0.4 /100 | #275 | Tragic 17.5% |
| Okinawans | 0.4 /100 | #276 | Tragic 17.4% |
| Brazilians | 0.4 /100 | #277 | Tragic 17.4% |
| Immigrants | Bahamas | 0.3 /100 | #278 | Tragic 17.4% |
| Immigrants | Kazakhstan | 0.3 /100 | #279 | Tragic 17.4% |
| Immigrants | Eastern Europe | 0.3 /100 | #280 | Tragic 17.4% |
| Immigrants | Latvia | 0.3 /100 | #281 | Tragic 17.4% |
| Immigrants | Ireland | 0.3 /100 | #282 | Tragic 17.3% |
| Blacks/African Americans | 0.3 /100 | #283 | Tragic 17.3% |
Demographics Similar to Immigrants from Cuba by 3 or more Vehicles in Household
In terms of 3 or more vehicles in household, the demographic groups most similar to Immigrants from Cuba are Panamanian (18.8%, a difference of 0.010%), Immigrants from Kenya (18.8%, a difference of 0.15%), Immigrants from Sierra Leone (18.7%, a difference of 0.15%), Eastern European (18.7%, a difference of 0.20%), and Immigrants from Nigeria (18.7%, a difference of 0.26%).
| Demographics | Rating | Rank | 3 or more Vehicles in Household |
| Immigrants | Eastern Asia | 14.1 /100 | #206 | Poor 18.8% |
| Immigrants | Chile | 13.6 /100 | #207 | Poor 18.8% |
| Immigrants | Burma/Myanmar | 13.6 /100 | #208 | Poor 18.8% |
| Immigrants | Egypt | 13.5 /100 | #209 | Poor 18.8% |
| Bulgarians | 13.1 /100 | #210 | Poor 18.8% |
| Immigrants | Kenya | 12.4 /100 | #211 | Poor 18.8% |
| Panamanians | 11.6 /100 | #212 | Poor 18.8% |
| Immigrants | Cuba | 11.6 /100 | #213 | Poor 18.8% |
| Immigrants | Sierra Leone | 10.8 /100 | #214 | Poor 18.7% |
| Eastern Europeans | 10.6 /100 | #215 | Poor 18.7% |
| Immigrants | Nigeria | 10.3 /100 | #216 | Poor 18.7% |
| Immigrants | Italy | 10.2 /100 | #217 | Poor 18.7% |
| Immigrants | Portugal | 8.9 /100 | #218 | Tragic 18.6% |
| Immigrants | Armenia | 8.6 /100 | #219 | Tragic 18.6% |
| Nigerians | 7.9 /100 | #220 | Tragic 18.6% |