Okinawan vs Immigrants from Zaire College, 1 year or more
COMPARE
Okinawan
Immigrants from Zaire
College, 1 year or more
College, 1 year or more Comparison
Okinawans
Immigrants from Zaire
69.0%
COLLEGE, 1 YEAR OR MORE
100.0/ 100
METRIC RATING
7th/ 347
METRIC RANK
58.3%
COLLEGE, 1 YEAR OR MORE
18.7/ 100
METRIC RATING
205th/ 347
METRIC RANK
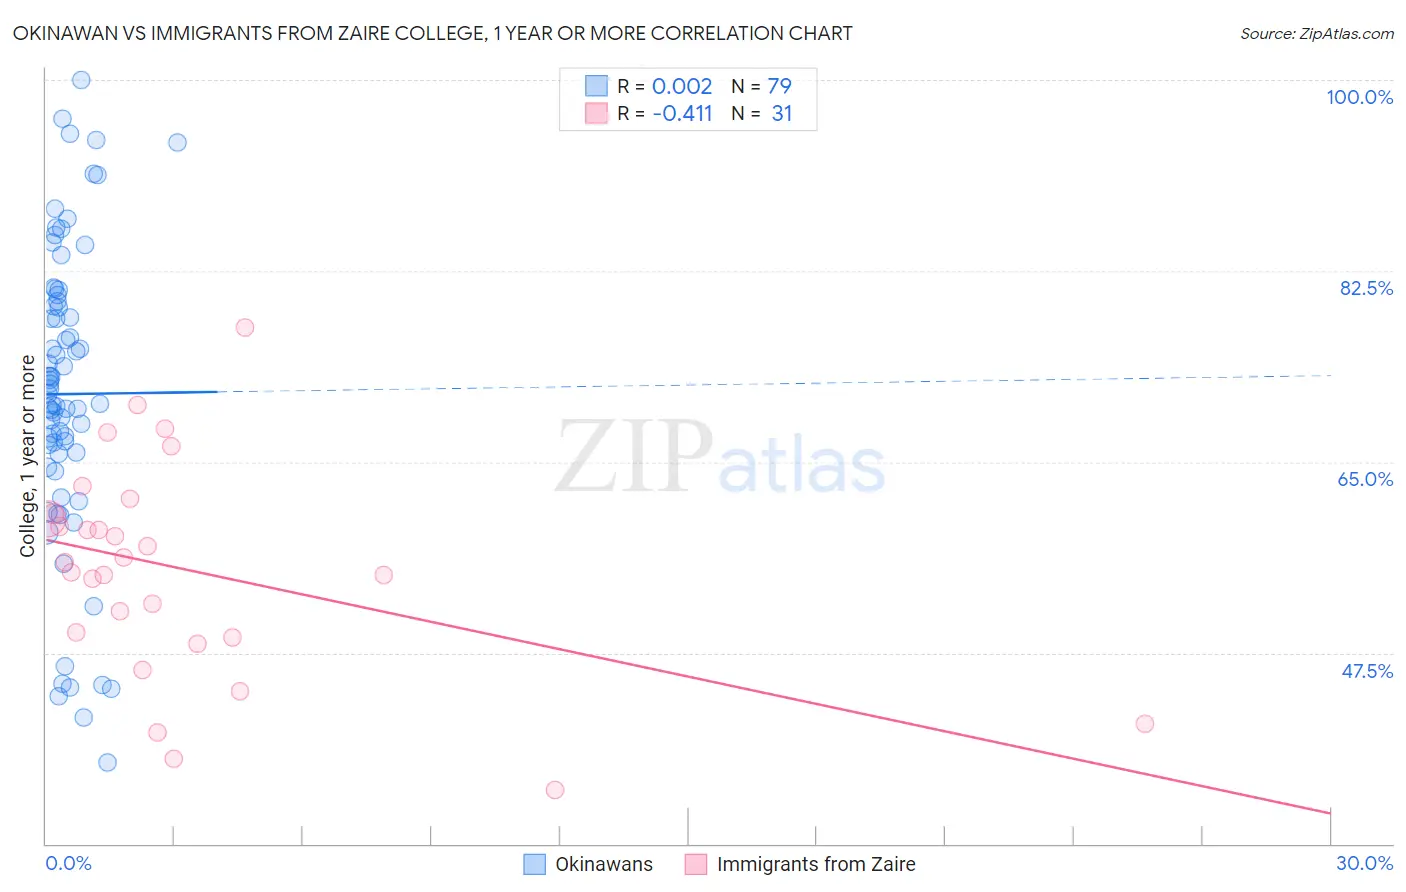
Okinawan vs Immigrants from Zaire College, 1 year or more Correlation Chart
The statistical analysis conducted on geographies consisting of 73,779,368 people shows no correlation between the proportion of Okinawans and percentage of population with at least college, 1 year or more education in the United States with a correlation coefficient (R) of 0.002 and weighted average of 69.0%. Similarly, the statistical analysis conducted on geographies consisting of 107,255,700 people shows a moderate negative correlation between the proportion of Immigrants from Zaire and percentage of population with at least college, 1 year or more education in the United States with a correlation coefficient (R) of -0.411 and weighted average of 58.3%, a difference of 18.4%.
College, 1 year or more Correlation Summary
| Measurement | Okinawan | Immigrants from Zaire |
| Minimum | 37.5% | 35.0% |
| Maximum | 100.0% | 77.4% |
| Range | 62.5% | 42.4% |
| Mean | 71.2% | 55.2% |
| Median | 71.2% | 55.8% |
| Interquartile 25% (IQ1) | 65.7% | 48.9% |
| Interquartile 75% (IQ3) | 79.7% | 60.2% |
| Interquartile Range (IQR) | 14.0% | 11.3% |
| Standard Deviation (Sample) | 13.7% | 9.8% |
| Standard Deviation (Population) | 13.6% | 9.6% |
Similar Demographics by College, 1 year or more
Demographics Similar to Okinawans by College, 1 year or more
In terms of college, 1 year or more, the demographic groups most similar to Okinawans are Thai (68.6%, a difference of 0.54%), Immigrants from Iran (69.5%, a difference of 0.77%), Immigrants from Taiwan (69.6%, a difference of 0.97%), Immigrants from India (69.6%, a difference of 0.97%), and Iranian (70.0%, a difference of 1.5%).
| Demographics | Rating | Rank | College, 1 year or more |
| Filipinos | 100.0 /100 | #1 | Exceptional 71.0% |
| Immigrants | Singapore | 100.0 /100 | #2 | Exceptional 70.1% |
| Iranians | 100.0 /100 | #3 | Exceptional 70.0% |
| Immigrants | Taiwan | 100.0 /100 | #4 | Exceptional 69.6% |
| Immigrants | India | 100.0 /100 | #5 | Exceptional 69.6% |
| Immigrants | Iran | 100.0 /100 | #6 | Exceptional 69.5% |
| Okinawans | 100.0 /100 | #7 | Exceptional 69.0% |
| Thais | 100.0 /100 | #8 | Exceptional 68.6% |
| Immigrants | Israel | 100.0 /100 | #9 | Exceptional 67.8% |
| Immigrants | Australia | 100.0 /100 | #10 | Exceptional 67.7% |
| Immigrants | South Central Asia | 100.0 /100 | #11 | Exceptional 67.1% |
| Cypriots | 100.0 /100 | #12 | Exceptional 67.0% |
| Immigrants | Sweden | 100.0 /100 | #13 | Exceptional 66.8% |
| Burmese | 100.0 /100 | #14 | Exceptional 66.7% |
| Cambodians | 100.0 /100 | #15 | Exceptional 66.7% |
Demographics Similar to Immigrants from Zaire by College, 1 year or more
In terms of college, 1 year or more, the demographic groups most similar to Immigrants from Zaire are Immigrants from Vietnam (58.2%, a difference of 0.040%), Panamanian (58.3%, a difference of 0.050%), Senegalese (58.2%, a difference of 0.16%), Ghanaian (58.4%, a difference of 0.19%), and Immigrants from South America (58.4%, a difference of 0.27%).
| Demographics | Rating | Rank | College, 1 year or more |
| Immigrants | South Eastern Asia | 25.1 /100 | #198 | Fair 58.5% |
| Slovaks | 24.6 /100 | #199 | Fair 58.5% |
| Spanish | 24.2 /100 | #200 | Fair 58.5% |
| Nigerians | 23.0 /100 | #201 | Fair 58.5% |
| Immigrants | South America | 21.9 /100 | #202 | Fair 58.4% |
| Ghanaians | 20.9 /100 | #203 | Fair 58.4% |
| Panamanians | 19.2 /100 | #204 | Poor 58.3% |
| Immigrants | Zaire | 18.7 /100 | #205 | Poor 58.3% |
| Immigrants | Vietnam | 18.2 /100 | #206 | Poor 58.2% |
| Senegalese | 16.9 /100 | #207 | Poor 58.2% |
| Immigrants | Uruguay | 15.2 /100 | #208 | Poor 58.1% |
| Immigrants | Middle Africa | 14.0 /100 | #209 | Poor 58.0% |
| Tsimshian | 13.5 /100 | #210 | Poor 57.9% |
| Immigrants | Nigeria | 13.3 /100 | #211 | Poor 57.9% |
| Immigrants | Senegal | 11.8 /100 | #212 | Poor 57.8% |