Nepalese vs Immigrants from Turkey 3 or more Vehicles in Household
COMPARE
Nepalese
Immigrants from Turkey
3 or more Vehicles in Household
3 or more Vehicles in Household Comparison
Nepalese
Immigrants from Turkey
24.9%
3 OR MORE VEHICLES IN HOUSEHOLD
100.0/ 100
METRIC RATING
10th/ 347
METRIC RANK
17.9%
3 OR MORE VEHICLES IN HOUSEHOLD
1.2/ 100
METRIC RATING
255th/ 347
METRIC RANK
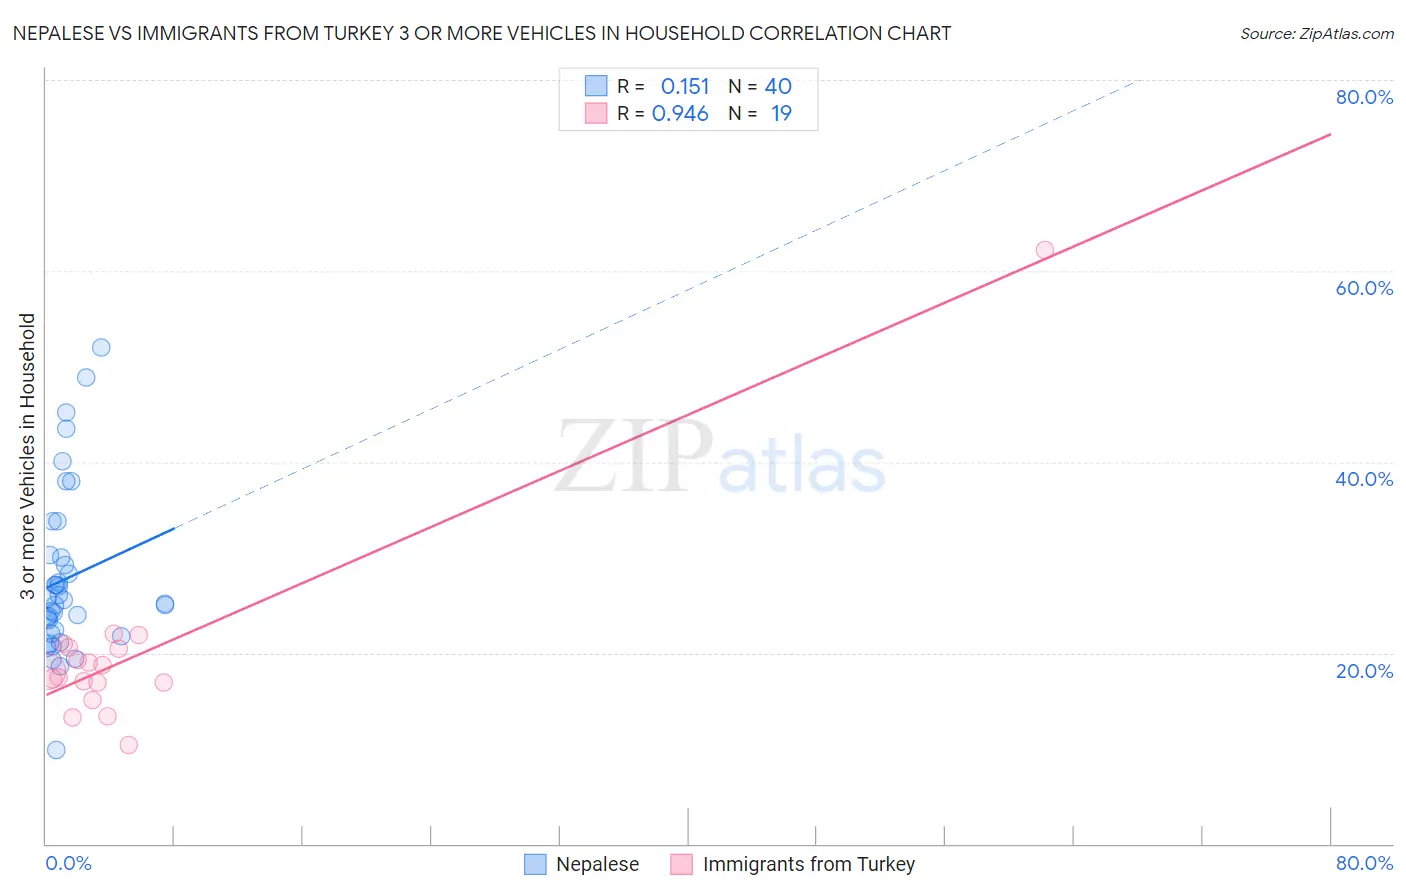
Nepalese vs Immigrants from Turkey 3 or more Vehicles in Household Correlation Chart
The statistical analysis conducted on geographies consisting of 24,521,755 people shows a poor positive correlation between the proportion of Nepalese and percentage of households with 3 or more vehicles available in the United States with a correlation coefficient (R) of 0.151 and weighted average of 24.9%. Similarly, the statistical analysis conducted on geographies consisting of 222,920,746 people shows a near-perfect positive correlation between the proportion of Immigrants from Turkey and percentage of households with 3 or more vehicles available in the United States with a correlation coefficient (R) of 0.946 and weighted average of 17.9%, a difference of 39.3%.
3 or more Vehicles in Household Correlation Summary
| Measurement | Nepalese | Immigrants from Turkey |
| Minimum | 9.8% | 10.4% |
| Maximum | 52.0% | 62.2% |
| Range | 42.3% | 51.8% |
| Mean | 27.8% | 20.0% |
| Median | 25.4% | 18.0% |
| Interquartile 25% (IQ1) | 22.2% | 16.8% |
| Interquartile 75% (IQ3) | 30.1% | 20.6% |
| Interquartile Range (IQR) | 7.9% | 3.7% |
| Standard Deviation (Sample) | 8.8% | 10.7% |
| Standard Deviation (Population) | 8.7% | 10.4% |
Similar Demographics by 3 or more Vehicles in Household
Demographics Similar to Nepalese by 3 or more Vehicles in Household
In terms of 3 or more vehicles in household, the demographic groups most similar to Nepalese are Native Hawaiian (24.9%, a difference of 0.090%), Shoshone (24.9%, a difference of 0.10%), Samoan (25.0%, a difference of 0.19%), Danish (24.7%, a difference of 0.79%), and Mexican (24.7%, a difference of 0.87%).
| Demographics | Rating | Rank | 3 or more Vehicles in Household |
| Tongans | 100.0 /100 | #3 | Exceptional 26.5% |
| Arapaho | 100.0 /100 | #4 | Exceptional 26.4% |
| Puget Sound Salish | 100.0 /100 | #5 | Exceptional 26.4% |
| Immigrants | Fiji | 100.0 /100 | #6 | Exceptional 26.1% |
| Colville | 100.0 /100 | #7 | Exceptional 25.8% |
| Samoans | 100.0 /100 | #8 | Exceptional 25.0% |
| Native Hawaiians | 100.0 /100 | #9 | Exceptional 24.9% |
| Nepalese | 100.0 /100 | #10 | Exceptional 24.9% |
| Shoshone | 100.0 /100 | #11 | Exceptional 24.9% |
| Danes | 100.0 /100 | #12 | Exceptional 24.7% |
| Mexicans | 100.0 /100 | #13 | Exceptional 24.7% |
| Immigrants | Mexico | 100.0 /100 | #14 | Exceptional 24.6% |
| Hawaiians | 100.0 /100 | #15 | Exceptional 24.3% |
| Basques | 100.0 /100 | #16 | Exceptional 24.3% |
| Koreans | 100.0 /100 | #17 | Exceptional 24.1% |
Demographics Similar to Immigrants from Turkey by 3 or more Vehicles in Household
In terms of 3 or more vehicles in household, the demographic groups most similar to Immigrants from Turkey are Immigrants from Ethiopia (17.9%, a difference of 0.030%), Ethiopian (17.9%, a difference of 0.030%), Subsaharan African (17.9%, a difference of 0.15%), Immigrants from Eritrea (17.8%, a difference of 0.20%), and Sudanese (17.8%, a difference of 0.20%).
| Demographics | Rating | Rank | 3 or more Vehicles in Household |
| Immigrants | Eastern Africa | 1.8 /100 | #248 | Tragic 18.0% |
| Immigrants | Saudi Arabia | 1.7 /100 | #249 | Tragic 18.0% |
| Venezuelans | 1.7 /100 | #250 | Tragic 18.0% |
| Alsatians | 1.5 /100 | #251 | Tragic 18.0% |
| Immigrants | Southern Europe | 1.4 /100 | #252 | Tragic 17.9% |
| Immigrants | Ethiopia | 1.3 /100 | #253 | Tragic 17.9% |
| Ethiopians | 1.2 /100 | #254 | Tragic 17.9% |
| Immigrants | Turkey | 1.2 /100 | #255 | Tragic 17.9% |
| Sub-Saharan Africans | 1.1 /100 | #256 | Tragic 17.9% |
| Immigrants | Eritrea | 1.1 /100 | #257 | Tragic 17.8% |
| Sudanese | 1.1 /100 | #258 | Tragic 17.8% |
| Uruguayans | 1.0 /100 | #259 | Tragic 17.8% |
| Ugandans | 0.9 /100 | #260 | Tragic 17.8% |
| Immigrants | Northern Africa | 0.9 /100 | #261 | Tragic 17.8% |
| Colombians | 0.9 /100 | #262 | Tragic 17.8% |