Moroccan vs Immigrants from North Macedonia Female Unemployment
COMPARE
Moroccan
Immigrants from North Macedonia
Female Unemployment
Female Unemployment Comparison
Moroccans
Immigrants from North Macedonia
5.5%
FEMALE UNEMPLOYMENT
3.4/ 100
METRIC RATING
233rd/ 347
METRIC RANK
5.1%
FEMALE UNEMPLOYMENT
88.3/ 100
METRIC RATING
119th/ 347
METRIC RANK
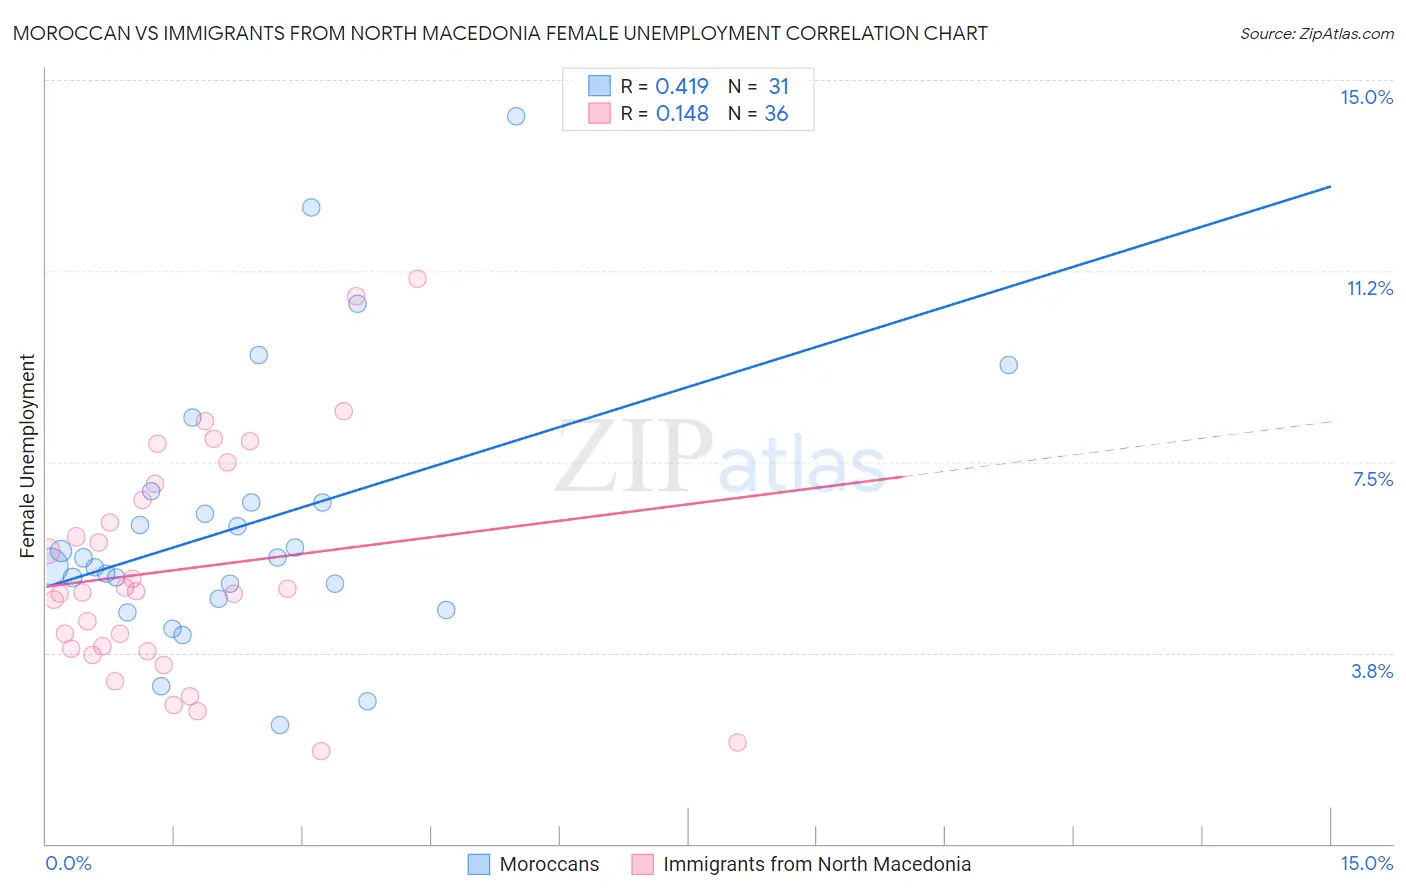
Moroccan vs Immigrants from North Macedonia Female Unemployment Correlation Chart
The statistical analysis conducted on geographies consisting of 201,565,511 people shows a moderate positive correlation between the proportion of Moroccans and unemploymnet rate among females in the United States with a correlation coefficient (R) of 0.419 and weighted average of 5.5%. Similarly, the statistical analysis conducted on geographies consisting of 74,255,623 people shows a poor positive correlation between the proportion of Immigrants from North Macedonia and unemploymnet rate among females in the United States with a correlation coefficient (R) of 0.148 and weighted average of 5.1%, a difference of 8.3%.
Female Unemployment Correlation Summary
| Measurement | Moroccan | Immigrants from North Macedonia |
| Minimum | 2.3% | 1.8% |
| Maximum | 14.3% | 11.1% |
| Range | 11.9% | 9.3% |
| Mean | 6.3% | 5.4% |
| Median | 5.6% | 4.9% |
| Interquartile 25% (IQ1) | 4.8% | 3.8% |
| Interquartile 75% (IQ3) | 6.7% | 6.9% |
| Interquartile Range (IQR) | 1.9% | 3.1% |
| Standard Deviation (Sample) | 2.7% | 2.3% |
| Standard Deviation (Population) | 2.6% | 2.2% |
Similar Demographics by Female Unemployment
Demographics Similar to Moroccans by Female Unemployment
In terms of female unemployment, the demographic groups most similar to Moroccans are Immigrants from Lebanon (5.5%, a difference of 0.020%), Immigrants from Iran (5.5%, a difference of 0.030%), Immigrants from Cambodia (5.5%, a difference of 0.060%), Immigrants from Panama (5.5%, a difference of 0.080%), and Sierra Leonean (5.5%, a difference of 0.10%).
| Demographics | Rating | Rank | Female Unemployment |
| Immigrants | Peru | 5.9 /100 | #226 | Tragic 5.5% |
| Immigrants | Philippines | 5.3 /100 | #227 | Tragic 5.5% |
| Israelis | 4.8 /100 | #228 | Tragic 5.5% |
| Panamanians | 4.7 /100 | #229 | Tragic 5.5% |
| Immigrants | Uruguay | 4.7 /100 | #230 | Tragic 5.5% |
| Immigrants | Iraq | 3.9 /100 | #231 | Tragic 5.5% |
| Liberians | 3.9 /100 | #232 | Tragic 5.5% |
| Moroccans | 3.4 /100 | #233 | Tragic 5.5% |
| Immigrants | Lebanon | 3.3 /100 | #234 | Tragic 5.5% |
| Immigrants | Iran | 3.3 /100 | #235 | Tragic 5.5% |
| Immigrants | Cambodia | 3.3 /100 | #236 | Tragic 5.5% |
| Immigrants | Panama | 3.2 /100 | #237 | Tragic 5.5% |
| Sierra Leoneans | 3.2 /100 | #238 | Tragic 5.5% |
| Aleuts | 3.0 /100 | #239 | Tragic 5.5% |
| Immigrants | South America | 2.9 /100 | #240 | Tragic 5.5% |
Demographics Similar to Immigrants from North Macedonia by Female Unemployment
In terms of female unemployment, the demographic groups most similar to Immigrants from North Macedonia are Immigrants from Romania (5.1%, a difference of 0.020%), Immigrants from Western Europe (5.1%, a difference of 0.030%), Immigrants from Germany (5.1%, a difference of 0.10%), Immigrants from South Africa (5.1%, a difference of 0.10%), and Immigrants from Europe (5.1%, a difference of 0.15%).
| Demographics | Rating | Rank | Female Unemployment |
| Estonians | 92.1 /100 | #112 | Exceptional 5.1% |
| Immigrants | Saudi Arabia | 91.2 /100 | #113 | Exceptional 5.1% |
| Immigrants | Turkey | 91.0 /100 | #114 | Exceptional 5.1% |
| Lebanese | 91.0 /100 | #115 | Exceptional 5.1% |
| Americans | 90.5 /100 | #116 | Exceptional 5.1% |
| Jordanians | 90.3 /100 | #117 | Exceptional 5.1% |
| Immigrants | Croatia | 89.9 /100 | #118 | Excellent 5.1% |
| Immigrants | North Macedonia | 88.3 /100 | #119 | Excellent 5.1% |
| Immigrants | Romania | 88.1 /100 | #120 | Excellent 5.1% |
| Immigrants | Western Europe | 88.1 /100 | #121 | Excellent 5.1% |
| Immigrants | Germany | 87.6 /100 | #122 | Excellent 5.1% |
| Immigrants | South Africa | 87.6 /100 | #123 | Excellent 5.1% |
| Immigrants | Europe | 87.2 /100 | #124 | Excellent 5.1% |
| Basques | 86.5 /100 | #125 | Excellent 5.1% |
| Immigrants | Korea | 86.3 /100 | #126 | Excellent 5.1% |