Moroccan vs Nigerian 2 or more Vehicles in Household
COMPARE
Moroccan
Nigerian
2 or more Vehicles in Household
2 or more Vehicles in Household Comparison
Moroccans
Nigerians
48.8%
2 OR MORE VEHICLES IN HOUSEHOLD
0.0/ 100
METRIC RATING
309th/ 347
METRIC RANK
52.8%
2 OR MORE VEHICLES IN HOUSEHOLD
0.9/ 100
METRIC RATING
253rd/ 347
METRIC RANK
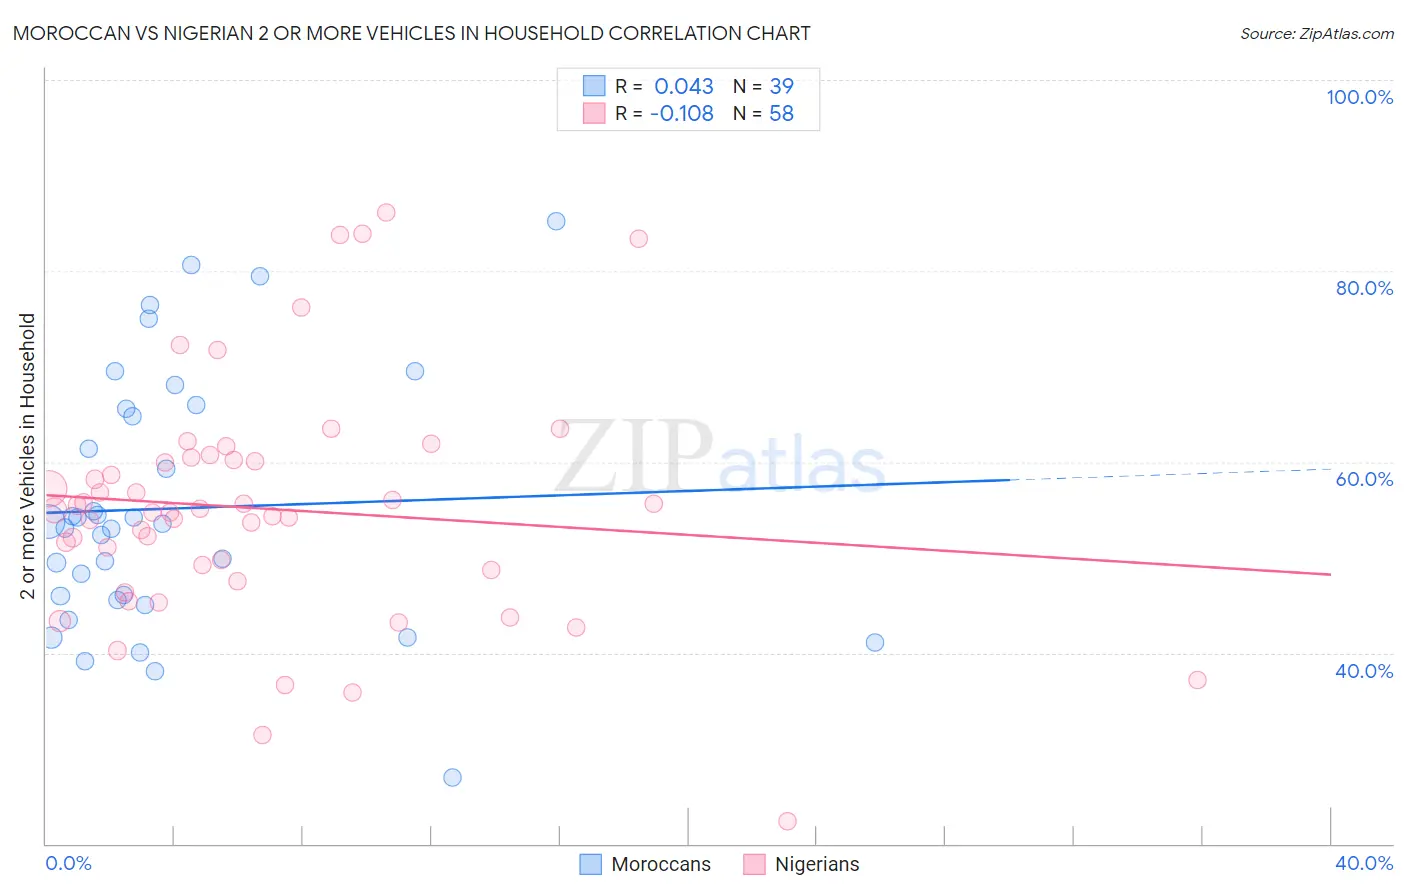
Moroccan vs Nigerian 2 or more Vehicles in Household Correlation Chart
The statistical analysis conducted on geographies consisting of 201,766,092 people shows no correlation between the proportion of Moroccans and percentage of households with 2 or more vehicles available in the United States with a correlation coefficient (R) of 0.043 and weighted average of 48.8%. Similarly, the statistical analysis conducted on geographies consisting of 332,498,440 people shows a poor negative correlation between the proportion of Nigerians and percentage of households with 2 or more vehicles available in the United States with a correlation coefficient (R) of -0.108 and weighted average of 52.8%, a difference of 8.1%.
2 or more Vehicles in Household Correlation Summary
| Measurement | Moroccan | Nigerian |
| Minimum | 27.0% | 22.3% |
| Maximum | 85.3% | 86.1% |
| Range | 58.3% | 63.8% |
| Mean | 55.1% | 55.1% |
| Median | 53.5% | 54.8% |
| Interquartile 25% (IQ1) | 45.6% | 48.7% |
| Interquartile 75% (IQ3) | 65.6% | 60.2% |
| Interquartile Range (IQR) | 20.0% | 11.5% |
| Standard Deviation (Sample) | 13.3% | 12.4% |
| Standard Deviation (Population) | 13.1% | 12.3% |
Similar Demographics by 2 or more Vehicles in Household
Demographics Similar to Moroccans by 2 or more Vehicles in Household
In terms of 2 or more vehicles in household, the demographic groups most similar to Moroccans are Albanian (49.0%, a difference of 0.35%), Hopi (49.0%, a difference of 0.42%), Immigrants from Israel (49.2%, a difference of 0.85%), Immigrants from Western Africa (49.4%, a difference of 1.1%), and Ghanaian (48.0%, a difference of 1.8%).
| Demographics | Rating | Rank | 2 or more Vehicles in Household |
| Immigrants | South America | 0.0 /100 | #302 | Tragic 50.2% |
| Tohono O'odham | 0.0 /100 | #303 | Tragic 50.0% |
| Immigrants | Belize | 0.0 /100 | #304 | Tragic 49.9% |
| Immigrants | Western Africa | 0.0 /100 | #305 | Tragic 49.4% |
| Immigrants | Israel | 0.0 /100 | #306 | Tragic 49.2% |
| Hopi | 0.0 /100 | #307 | Tragic 49.0% |
| Albanians | 0.0 /100 | #308 | Tragic 49.0% |
| Moroccans | 0.0 /100 | #309 | Tragic 48.8% |
| Ghanaians | 0.0 /100 | #310 | Tragic 48.0% |
| Immigrants | Belarus | 0.0 /100 | #311 | Tragic 47.9% |
| Haitians | 0.0 /100 | #312 | Tragic 47.6% |
| U.S. Virgin Islanders | 0.0 /100 | #313 | Tragic 47.5% |
| Immigrants | Ghana | 0.0 /100 | #314 | Tragic 47.4% |
| Puerto Ricans | 0.0 /100 | #315 | Tragic 47.1% |
| Cape Verdeans | 0.0 /100 | #316 | Tragic 46.8% |
Demographics Similar to Nigerians by 2 or more Vehicles in Household
In terms of 2 or more vehicles in household, the demographic groups most similar to Nigerians are Immigrants from Portugal (52.8%, a difference of 0.050%), Immigrants from Sudan (52.8%, a difference of 0.060%), Immigrants from Brazil (52.8%, a difference of 0.10%), Mongolian (52.8%, a difference of 0.10%), and Colombian (52.9%, a difference of 0.15%).
| Demographics | Rating | Rank | 2 or more Vehicles in Household |
| Immigrants | Nigeria | 1.2 /100 | #246 | Tragic 52.9% |
| Sierra Leoneans | 1.2 /100 | #247 | Tragic 52.9% |
| Colombians | 1.1 /100 | #248 | Tragic 52.9% |
| Immigrants | Brazil | 1.0 /100 | #249 | Tragic 52.8% |
| Mongolians | 1.0 /100 | #250 | Tragic 52.8% |
| Immigrants | Sudan | 1.0 /100 | #251 | Tragic 52.8% |
| Immigrants | Portugal | 1.0 /100 | #252 | Tragic 52.8% |
| Nigerians | 0.9 /100 | #253 | Tragic 52.8% |
| Immigrants | Malaysia | 0.8 /100 | #254 | Tragic 52.7% |
| Uruguayans | 0.7 /100 | #255 | Tragic 52.7% |
| Immigrants | Eritrea | 0.7 /100 | #256 | Tragic 52.6% |
| Immigrants | Hong Kong | 0.6 /100 | #257 | Tragic 52.6% |
| Central American Indians | 0.6 /100 | #258 | Tragic 52.5% |
| Alsatians | 0.6 /100 | #259 | Tragic 52.5% |
| Immigrants | Bahamas | 0.5 /100 | #260 | Tragic 52.5% |