Moroccan vs Indonesian 2 or more Vehicles in Household
COMPARE
Moroccan
Indonesian
2 or more Vehicles in Household
2 or more Vehicles in Household Comparison
Moroccans
Indonesians
48.8%
2 OR MORE VEHICLES IN HOUSEHOLD
0.0/ 100
METRIC RATING
309th/ 347
METRIC RANK
53.4%
2 OR MORE VEHICLES IN HOUSEHOLD
2.7/ 100
METRIC RATING
236th/ 347
METRIC RANK
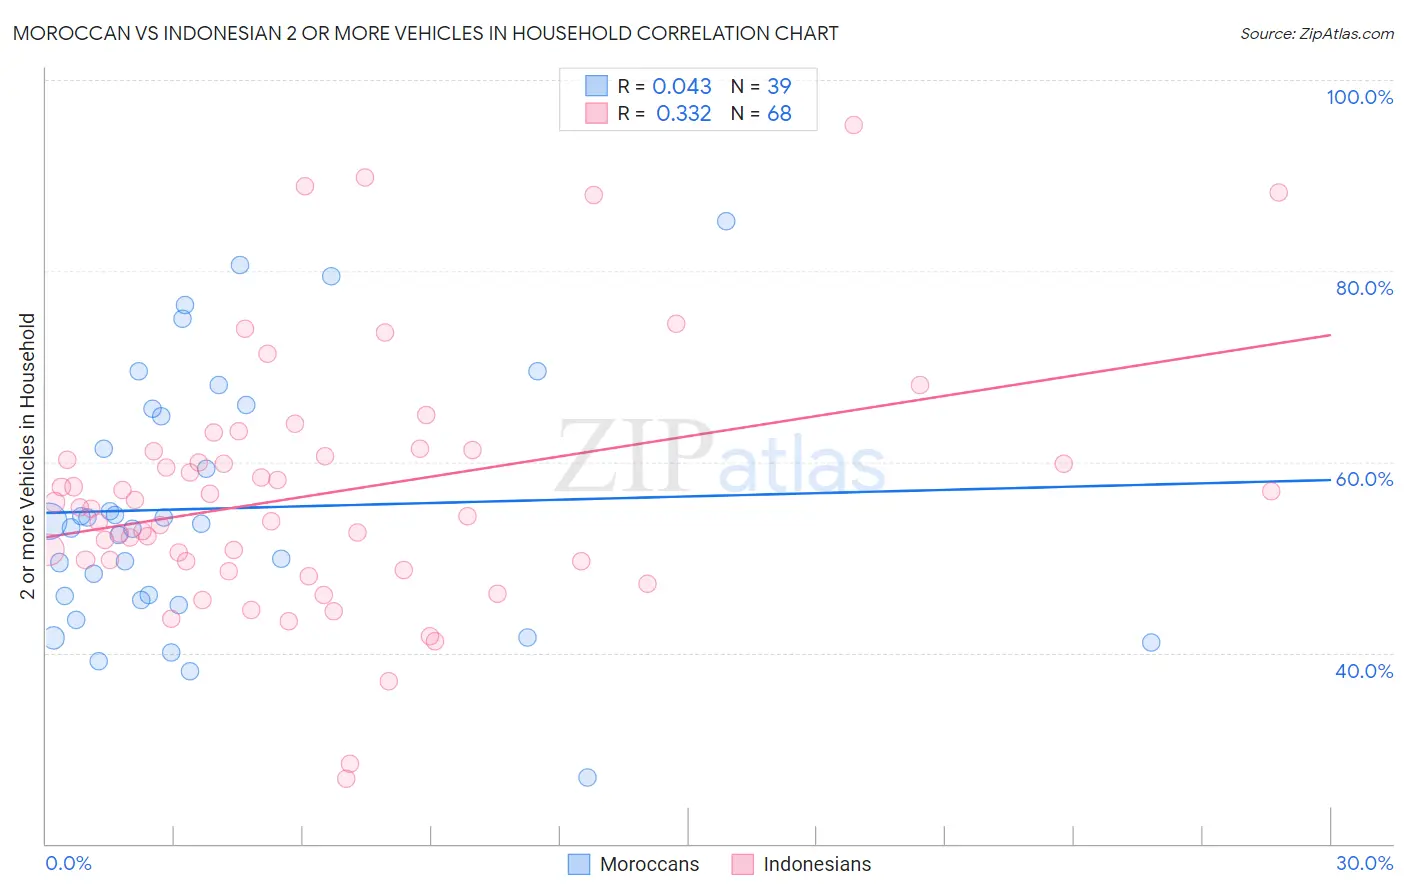
Moroccan vs Indonesian 2 or more Vehicles in Household Correlation Chart
The statistical analysis conducted on geographies consisting of 201,766,092 people shows no correlation between the proportion of Moroccans and percentage of households with 2 or more vehicles available in the United States with a correlation coefficient (R) of 0.043 and weighted average of 48.8%. Similarly, the statistical analysis conducted on geographies consisting of 162,658,811 people shows a mild positive correlation between the proportion of Indonesians and percentage of households with 2 or more vehicles available in the United States with a correlation coefficient (R) of 0.332 and weighted average of 53.4%, a difference of 9.3%.
2 or more Vehicles in Household Correlation Summary
| Measurement | Moroccan | Indonesian |
| Minimum | 27.0% | 26.8% |
| Maximum | 85.3% | 95.3% |
| Range | 58.3% | 68.6% |
| Mean | 55.1% | 56.7% |
| Median | 53.5% | 55.1% |
| Interquartile 25% (IQ1) | 45.6% | 49.6% |
| Interquartile 75% (IQ3) | 65.6% | 60.8% |
| Interquartile Range (IQR) | 20.0% | 11.2% |
| Standard Deviation (Sample) | 13.3% | 13.1% |
| Standard Deviation (Population) | 13.1% | 13.0% |
Similar Demographics by 2 or more Vehicles in Household
Demographics Similar to Moroccans by 2 or more Vehicles in Household
In terms of 2 or more vehicles in household, the demographic groups most similar to Moroccans are Albanian (49.0%, a difference of 0.35%), Hopi (49.0%, a difference of 0.42%), Immigrants from Israel (49.2%, a difference of 0.85%), Immigrants from Western Africa (49.4%, a difference of 1.1%), and Ghanaian (48.0%, a difference of 1.8%).
| Demographics | Rating | Rank | 2 or more Vehicles in Household |
| Immigrants | South America | 0.0 /100 | #302 | Tragic 50.2% |
| Tohono O'odham | 0.0 /100 | #303 | Tragic 50.0% |
| Immigrants | Belize | 0.0 /100 | #304 | Tragic 49.9% |
| Immigrants | Western Africa | 0.0 /100 | #305 | Tragic 49.4% |
| Immigrants | Israel | 0.0 /100 | #306 | Tragic 49.2% |
| Hopi | 0.0 /100 | #307 | Tragic 49.0% |
| Albanians | 0.0 /100 | #308 | Tragic 49.0% |
| Moroccans | 0.0 /100 | #309 | Tragic 48.8% |
| Ghanaians | 0.0 /100 | #310 | Tragic 48.0% |
| Immigrants | Belarus | 0.0 /100 | #311 | Tragic 47.9% |
| Haitians | 0.0 /100 | #312 | Tragic 47.6% |
| U.S. Virgin Islanders | 0.0 /100 | #313 | Tragic 47.5% |
| Immigrants | Ghana | 0.0 /100 | #314 | Tragic 47.4% |
| Puerto Ricans | 0.0 /100 | #315 | Tragic 47.1% |
| Cape Verdeans | 0.0 /100 | #316 | Tragic 46.8% |
Demographics Similar to Indonesians by 2 or more Vehicles in Household
In terms of 2 or more vehicles in household, the demographic groups most similar to Indonesians are Immigrants from Middle Africa (53.4%, a difference of 0.10%), Macedonian (53.3%, a difference of 0.11%), Immigrants from Switzerland (53.4%, a difference of 0.13%), Ugandan (53.5%, a difference of 0.18%), and Immigrants from Armenia (53.3%, a difference of 0.18%).
| Demographics | Rating | Rank | 2 or more Vehicles in Household |
| Immigrants | Turkey | 3.8 /100 | #229 | Tragic 53.6% |
| Immigrants | Nepal | 3.6 /100 | #230 | Tragic 53.5% |
| Panamanians | 3.4 /100 | #231 | Tragic 53.5% |
| Immigrants | Guatemala | 3.2 /100 | #232 | Tragic 53.5% |
| Ugandans | 3.2 /100 | #233 | Tragic 53.5% |
| Immigrants | Switzerland | 3.0 /100 | #234 | Tragic 53.4% |
| Immigrants | Middle Africa | 3.0 /100 | #235 | Tragic 53.4% |
| Indonesians | 2.7 /100 | #236 | Tragic 53.4% |
| Macedonians | 2.4 /100 | #237 | Tragic 53.3% |
| Immigrants | Armenia | 2.3 /100 | #238 | Tragic 53.3% |
| Cambodians | 2.3 /100 | #239 | Tragic 53.3% |
| Immigrants | Europe | 2.1 /100 | #240 | Tragic 53.2% |
| Immigrants | Sierra Leone | 2.1 /100 | #241 | Tragic 53.2% |
| Immigrants | Eastern Asia | 2.1 /100 | #242 | Tragic 53.2% |
| Ethiopians | 1.7 /100 | #243 | Tragic 53.1% |