Moroccan vs Immigrants from North Macedonia Cognitive Disability
COMPARE
Moroccan
Immigrants from North Macedonia
Cognitive Disability
Cognitive Disability Comparison
Moroccans
Immigrants from North Macedonia
17.6%
COGNITIVE DISABILITY
5.9/ 100
METRIC RATING
221st/ 347
METRIC RANK
16.3%
COGNITIVE DISABILITY
100.0/ 100
METRIC RATING
17th/ 347
METRIC RANK
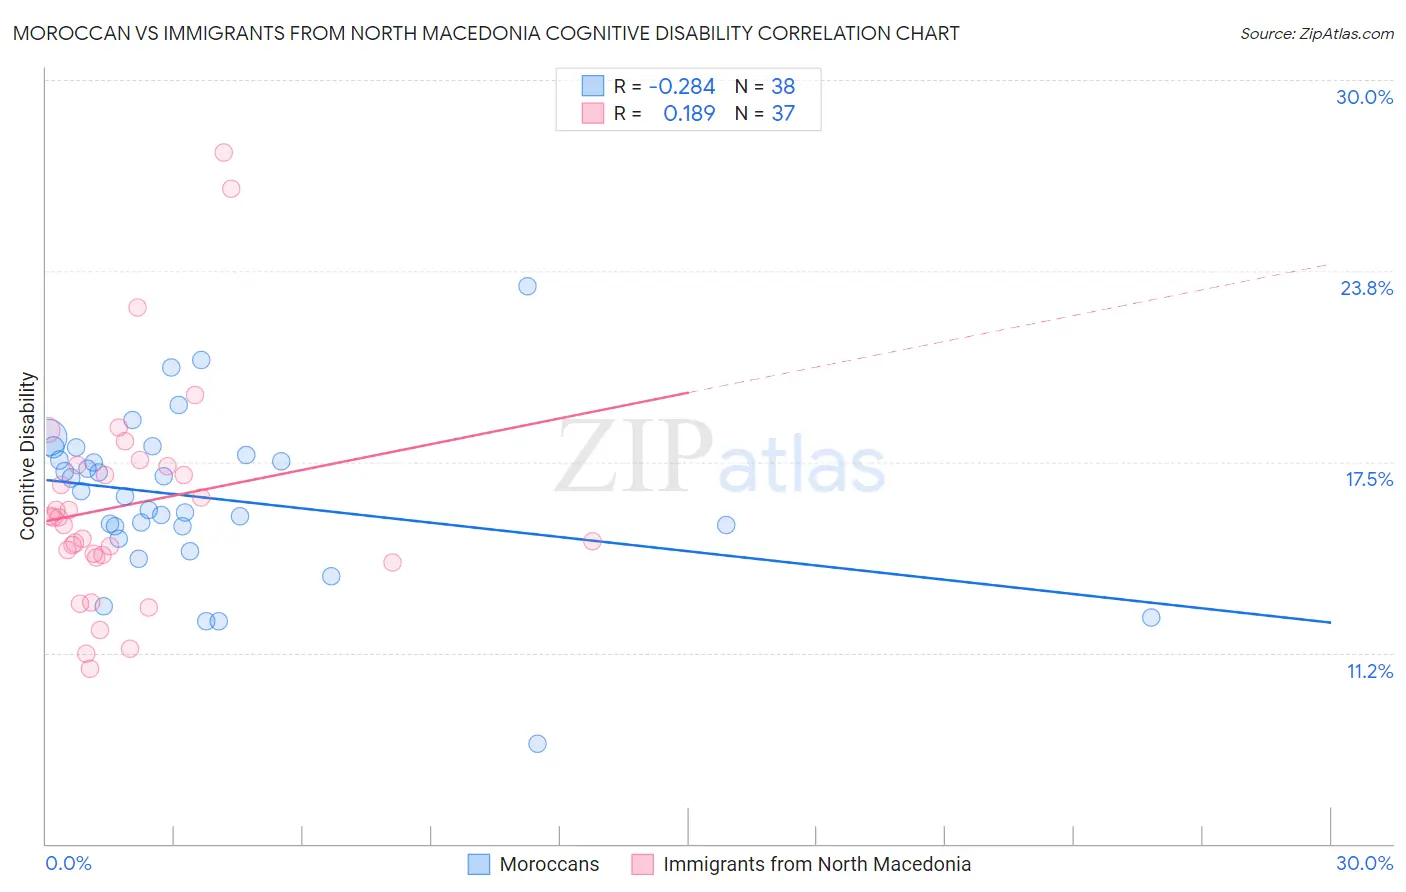
Moroccan vs Immigrants from North Macedonia Cognitive Disability Correlation Chart
The statistical analysis conducted on geographies consisting of 201,805,523 people shows a weak negative correlation between the proportion of Moroccans and percentage of population with cognitive disability in the United States with a correlation coefficient (R) of -0.284 and weighted average of 17.6%. Similarly, the statistical analysis conducted on geographies consisting of 74,300,435 people shows a poor positive correlation between the proportion of Immigrants from North Macedonia and percentage of population with cognitive disability in the United States with a correlation coefficient (R) of 0.189 and weighted average of 16.3%, a difference of 8.0%.
Cognitive Disability Correlation Summary
| Measurement | Moroccan | Immigrants from North Macedonia |
| Minimum | 8.3% | 10.7% |
| Maximum | 23.2% | 27.6% |
| Range | 15.0% | 16.9% |
| Mean | 16.3% | 16.1% |
| Median | 16.4% | 15.7% |
| Interquartile 25% (IQ1) | 15.4% | 14.4% |
| Interquartile 75% (IQ3) | 17.7% | 17.4% |
| Interquartile Range (IQR) | 2.3% | 3.0% |
| Standard Deviation (Sample) | 2.7% | 3.6% |
| Standard Deviation (Population) | 2.7% | 3.5% |
Similar Demographics by Cognitive Disability
Demographics Similar to Moroccans by Cognitive Disability
In terms of cognitive disability, the demographic groups most similar to Moroccans are Zimbabwean (17.6%, a difference of 0.020%), Icelander (17.6%, a difference of 0.050%), Immigrants from Sierra Leone (17.6%, a difference of 0.050%), Salvadoran (17.6%, a difference of 0.090%), and Okinawan (17.6%, a difference of 0.10%).
| Demographics | Rating | Rank | Cognitive Disability |
| Immigrants | El Salvador | 7.0 /100 | #214 | Tragic 17.6% |
| Alaskan Athabascans | 6.9 /100 | #215 | Tragic 17.6% |
| Okinawans | 6.8 /100 | #216 | Tragic 17.6% |
| Salvadorans | 6.7 /100 | #217 | Tragic 17.6% |
| Icelanders | 6.4 /100 | #218 | Tragic 17.6% |
| Immigrants | Sierra Leone | 6.3 /100 | #219 | Tragic 17.6% |
| Zimbabweans | 6.1 /100 | #220 | Tragic 17.6% |
| Moroccans | 5.9 /100 | #221 | Tragic 17.6% |
| Central Americans | 4.5 /100 | #222 | Tragic 17.7% |
| Alsatians | 4.5 /100 | #223 | Tragic 17.7% |
| Fijians | 3.4 /100 | #224 | Tragic 17.7% |
| Vietnamese | 3.4 /100 | #225 | Tragic 17.7% |
| Marshallese | 2.7 /100 | #226 | Tragic 17.7% |
| Immigrants | St. Vincent and the Grenadines | 2.6 /100 | #227 | Tragic 17.7% |
| Immigrants | Central America | 2.3 /100 | #228 | Tragic 17.7% |
Demographics Similar to Immigrants from North Macedonia by Cognitive Disability
In terms of cognitive disability, the demographic groups most similar to Immigrants from North Macedonia are Eastern European (16.3%, a difference of 0.020%), Immigrants from Northern Europe (16.3%, a difference of 0.060%), Immigrants from Bolivia (16.3%, a difference of 0.070%), Bulgarian (16.3%, a difference of 0.080%), and Immigrants from Cuba (16.3%, a difference of 0.12%).
| Demographics | Rating | Rank | Cognitive Disability |
| Immigrants | Scotland | 100.0 /100 | #10 | Exceptional 16.2% |
| Immigrants | Czechoslovakia | 100.0 /100 | #11 | Exceptional 16.2% |
| Maltese | 100.0 /100 | #12 | Exceptional 16.2% |
| Lithuanians | 100.0 /100 | #13 | Exceptional 16.3% |
| Immigrants | Austria | 100.0 /100 | #14 | Exceptional 16.3% |
| Immigrants | Greece | 100.0 /100 | #15 | Exceptional 16.3% |
| Eastern Europeans | 100.0 /100 | #16 | Exceptional 16.3% |
| Immigrants | North Macedonia | 100.0 /100 | #17 | Exceptional 16.3% |
| Immigrants | Northern Europe | 100.0 /100 | #18 | Exceptional 16.3% |
| Immigrants | Bolivia | 100.0 /100 | #19 | Exceptional 16.3% |
| Bulgarians | 100.0 /100 | #20 | Exceptional 16.3% |
| Immigrants | Cuba | 100.0 /100 | #21 | Exceptional 16.3% |
| Immigrants | South Central Asia | 99.9 /100 | #22 | Exceptional 16.4% |
| Croatians | 99.9 /100 | #23 | Exceptional 16.4% |
| Immigrants | Argentina | 99.9 /100 | #24 | Exceptional 16.4% |