Mongolian vs Jamaican 4 or more Vehicles in Household
COMPARE
Mongolian
Jamaican
4 or more Vehicles in Household
4 or more Vehicles in Household Comparison
Mongolians
Jamaicans
5.8%
4 OR MORE VEHICLES IN HOUSEHOLD
3.7/ 100
METRIC RATING
241st/ 347
METRIC RANK
4.6%
4 OR MORE VEHICLES IN HOUSEHOLD
0.0/ 100
METRIC RATING
318th/ 347
METRIC RANK
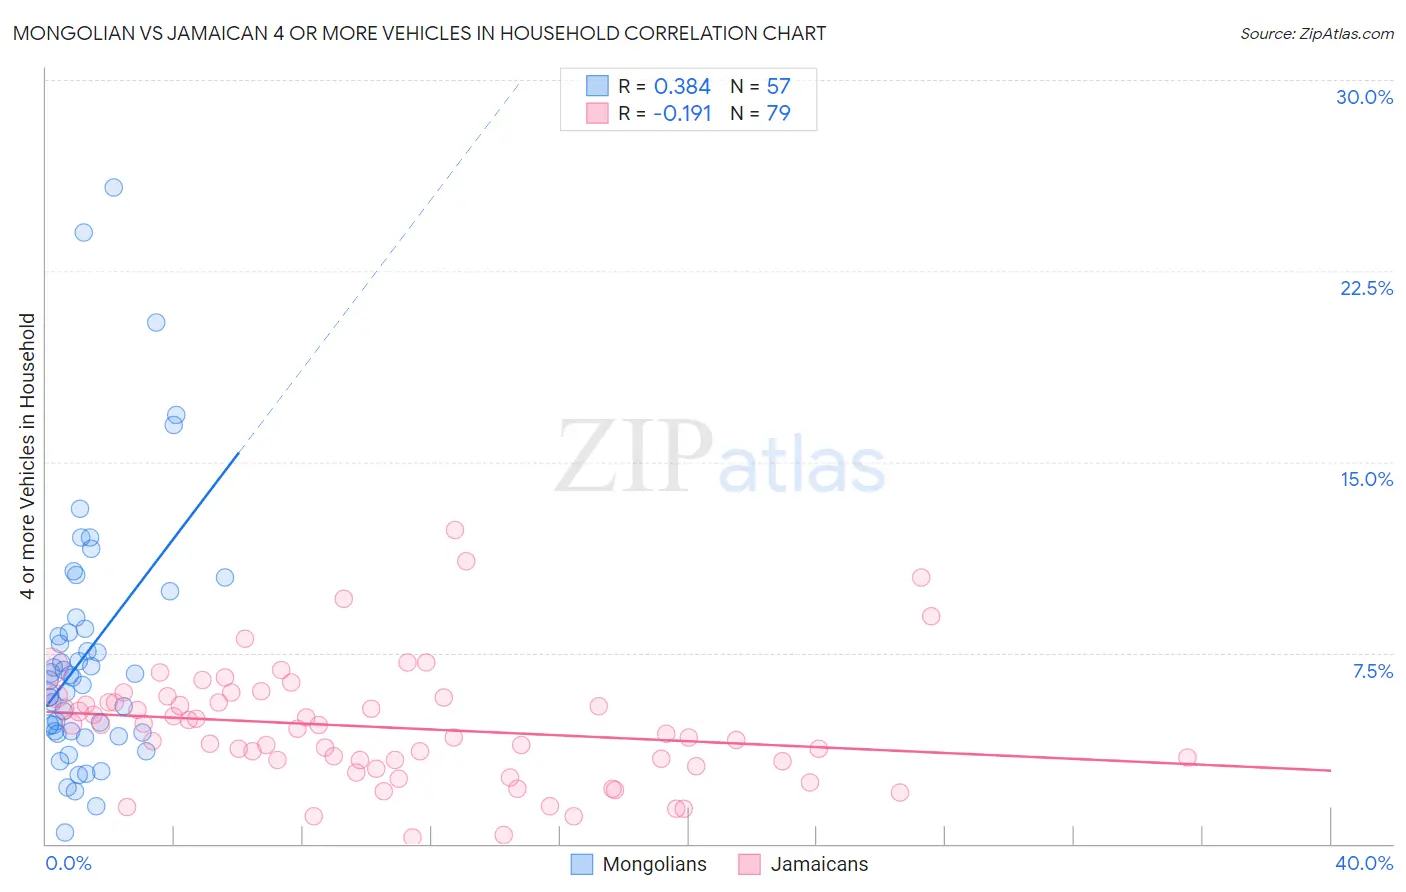
Mongolian vs Jamaican 4 or more Vehicles in Household Correlation Chart
The statistical analysis conducted on geographies consisting of 139,675,009 people shows a mild positive correlation between the proportion of Mongolians and percentage of households with 4 or more vehicles available in the United States with a correlation coefficient (R) of 0.384 and weighted average of 5.8%. Similarly, the statistical analysis conducted on geographies consisting of 366,007,173 people shows a poor negative correlation between the proportion of Jamaicans and percentage of households with 4 or more vehicles available in the United States with a correlation coefficient (R) of -0.191 and weighted average of 4.6%, a difference of 25.3%.
4 or more Vehicles in Household Correlation Summary
| Measurement | Mongolian | Jamaican |
| Minimum | 0.45% | 0.24% |
| Maximum | 25.8% | 12.3% |
| Range | 25.3% | 12.1% |
| Mean | 7.5% | 4.6% |
| Median | 6.5% | 4.5% |
| Interquartile 25% (IQ1) | 4.4% | 3.2% |
| Interquartile 75% (IQ3) | 8.7% | 5.7% |
| Interquartile Range (IQR) | 4.3% | 2.5% |
| Standard Deviation (Sample) | 5.1% | 2.3% |
| Standard Deviation (Population) | 5.0% | 2.3% |
Similar Demographics by 4 or more Vehicles in Household
Demographics Similar to Mongolians by 4 or more Vehicles in Household
In terms of 4 or more vehicles in household, the demographic groups most similar to Mongolians are Immigrants from Poland (5.8%, a difference of 0.090%), Immigrants from Australia (5.8%, a difference of 0.14%), Immigrants from Middle Africa (5.8%, a difference of 0.21%), Immigrants from Belgium (5.8%, a difference of 0.23%), and Turkish (5.8%, a difference of 0.35%).
| Demographics | Rating | Rank | 4 or more Vehicles in Household |
| Africans | 4.6 /100 | #234 | Tragic 5.8% |
| Immigrants | Hungary | 4.6 /100 | #235 | Tragic 5.8% |
| Immigrants | Eritrea | 4.5 /100 | #236 | Tragic 5.8% |
| Turks | 4.1 /100 | #237 | Tragic 5.8% |
| Immigrants | Belgium | 4.0 /100 | #238 | Tragic 5.8% |
| Immigrants | Australia | 3.8 /100 | #239 | Tragic 5.8% |
| Immigrants | Poland | 3.8 /100 | #240 | Tragic 5.8% |
| Mongolians | 3.7 /100 | #241 | Tragic 5.8% |
| Immigrants | Middle Africa | 3.4 /100 | #242 | Tragic 5.8% |
| Immigrants | Czechoslovakia | 3.2 /100 | #243 | Tragic 5.8% |
| Ethiopians | 3.2 /100 | #244 | Tragic 5.8% |
| Bulgarians | 3.1 /100 | #245 | Tragic 5.8% |
| Immigrants | North Macedonia | 2.5 /100 | #246 | Tragic 5.7% |
| Immigrants | Ethiopia | 2.4 /100 | #247 | Tragic 5.7% |
| Immigrants | Eastern Africa | 2.4 /100 | #248 | Tragic 5.7% |
Demographics Similar to Jamaicans by 4 or more Vehicles in Household
In terms of 4 or more vehicles in household, the demographic groups most similar to Jamaicans are U.S. Virgin Islander (4.6%, a difference of 0.24%), Haitian (4.6%, a difference of 0.65%), Puerto Rican (4.7%, a difference of 1.9%), Immigrants from Belarus (4.7%, a difference of 2.4%), and Immigrants from West Indies (4.7%, a difference of 2.5%).
| Demographics | Rating | Rank | 4 or more Vehicles in Household |
| Houma | 0.0 /100 | #311 | Tragic 4.9% |
| Albanians | 0.0 /100 | #312 | Tragic 4.8% |
| Immigrants | Israel | 0.0 /100 | #313 | Tragic 4.8% |
| Immigrants | West Indies | 0.0 /100 | #314 | Tragic 4.7% |
| Immigrants | Belarus | 0.0 /100 | #315 | Tragic 4.7% |
| Puerto Ricans | 0.0 /100 | #316 | Tragic 4.7% |
| U.S. Virgin Islanders | 0.0 /100 | #317 | Tragic 4.6% |
| Jamaicans | 0.0 /100 | #318 | Tragic 4.6% |
| Haitians | 0.0 /100 | #319 | Tragic 4.6% |
| Immigrants | Haiti | 0.0 /100 | #320 | Tragic 4.5% |
| Ecuadorians | 0.0 /100 | #321 | Tragic 4.5% |
| Immigrants | Yemen | 0.0 /100 | #322 | Tragic 4.5% |
| Immigrants | Caribbean | 0.0 /100 | #323 | Tragic 4.4% |
| Soviet Union | 0.0 /100 | #324 | Tragic 4.4% |
| Immigrants | Jamaica | 0.0 /100 | #325 | Tragic 4.4% |