Mongolian vs Immigrants from Scotland 4 or more Vehicles in Household
COMPARE
Mongolian
Immigrants from Scotland
4 or more Vehicles in Household
4 or more Vehicles in Household Comparison
Mongolians
Immigrants from Scotland
5.8%
4 OR MORE VEHICLES IN HOUSEHOLD
3.7/ 100
METRIC RATING
241st/ 347
METRIC RANK
6.7%
4 OR MORE VEHICLES IN HOUSEHOLD
89.0/ 100
METRIC RATING
130th/ 347
METRIC RANK
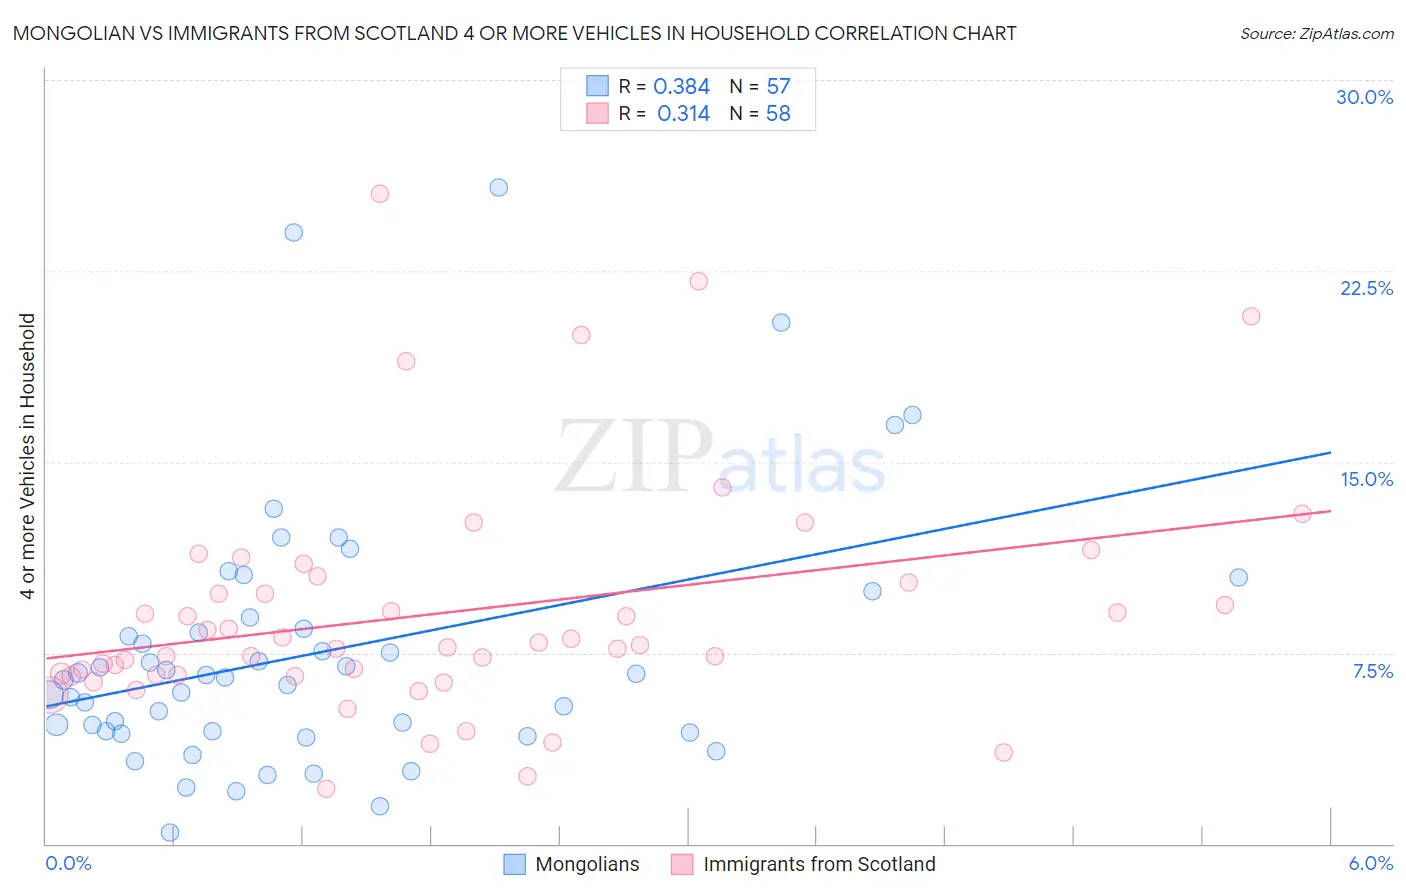
Mongolian vs Immigrants from Scotland 4 or more Vehicles in Household Correlation Chart
The statistical analysis conducted on geographies consisting of 139,675,009 people shows a mild positive correlation between the proportion of Mongolians and percentage of households with 4 or more vehicles available in the United States with a correlation coefficient (R) of 0.384 and weighted average of 5.8%. Similarly, the statistical analysis conducted on geographies consisting of 195,944,485 people shows a mild positive correlation between the proportion of Immigrants from Scotland and percentage of households with 4 or more vehicles available in the United States with a correlation coefficient (R) of 0.314 and weighted average of 6.7%, a difference of 14.8%.
4 or more Vehicles in Household Correlation Summary
| Measurement | Mongolian | Immigrants from Scotland |
| Minimum | 0.45% | 2.2% |
| Maximum | 25.8% | 25.6% |
| Range | 25.3% | 23.4% |
| Mean | 7.5% | 9.1% |
| Median | 6.5% | 7.7% |
| Interquartile 25% (IQ1) | 4.4% | 6.6% |
| Interquartile 75% (IQ3) | 8.7% | 10.3% |
| Interquartile Range (IQR) | 4.3% | 3.6% |
| Standard Deviation (Sample) | 5.1% | 4.6% |
| Standard Deviation (Population) | 5.0% | 4.6% |
Similar Demographics by 4 or more Vehicles in Household
Demographics Similar to Mongolians by 4 or more Vehicles in Household
In terms of 4 or more vehicles in household, the demographic groups most similar to Mongolians are Immigrants from Poland (5.8%, a difference of 0.090%), Immigrants from Australia (5.8%, a difference of 0.14%), Immigrants from Middle Africa (5.8%, a difference of 0.21%), Immigrants from Belgium (5.8%, a difference of 0.23%), and Turkish (5.8%, a difference of 0.35%).
| Demographics | Rating | Rank | 4 or more Vehicles in Household |
| Africans | 4.6 /100 | #234 | Tragic 5.8% |
| Immigrants | Hungary | 4.6 /100 | #235 | Tragic 5.8% |
| Immigrants | Eritrea | 4.5 /100 | #236 | Tragic 5.8% |
| Turks | 4.1 /100 | #237 | Tragic 5.8% |
| Immigrants | Belgium | 4.0 /100 | #238 | Tragic 5.8% |
| Immigrants | Australia | 3.8 /100 | #239 | Tragic 5.8% |
| Immigrants | Poland | 3.8 /100 | #240 | Tragic 5.8% |
| Mongolians | 3.7 /100 | #241 | Tragic 5.8% |
| Immigrants | Middle Africa | 3.4 /100 | #242 | Tragic 5.8% |
| Immigrants | Czechoslovakia | 3.2 /100 | #243 | Tragic 5.8% |
| Ethiopians | 3.2 /100 | #244 | Tragic 5.8% |
| Bulgarians | 3.1 /100 | #245 | Tragic 5.8% |
| Immigrants | North Macedonia | 2.5 /100 | #246 | Tragic 5.7% |
| Immigrants | Ethiopia | 2.4 /100 | #247 | Tragic 5.7% |
| Immigrants | Eastern Africa | 2.4 /100 | #248 | Tragic 5.7% |
Demographics Similar to Immigrants from Scotland by 4 or more Vehicles in Household
In terms of 4 or more vehicles in household, the demographic groups most similar to Immigrants from Scotland are Maltese (6.7%, a difference of 0.15%), Immigrants from Netherlands (6.6%, a difference of 0.29%), Armenian (6.6%, a difference of 0.48%), Ottawa (6.6%, a difference of 0.50%), and Tohono O'odham (6.6%, a difference of 0.53%).
| Demographics | Rating | Rank | 4 or more Vehicles in Household |
| Immigrants | Immigrants | 94.6 /100 | #123 | Exceptional 6.8% |
| Immigrants | Asia | 94.4 /100 | #124 | Exceptional 6.8% |
| Austrians | 94.1 /100 | #125 | Exceptional 6.8% |
| Belgians | 94.1 /100 | #126 | Exceptional 6.8% |
| Immigrants | Korea | 93.8 /100 | #127 | Exceptional 6.8% |
| Immigrants | Bolivia | 92.5 /100 | #128 | Exceptional 6.7% |
| Immigrants | England | 92.0 /100 | #129 | Exceptional 6.7% |
| Immigrants | Scotland | 89.0 /100 | #130 | Excellent 6.7% |
| Maltese | 88.4 /100 | #131 | Excellent 6.7% |
| Immigrants | Netherlands | 87.8 /100 | #132 | Excellent 6.6% |
| Armenians | 86.9 /100 | #133 | Excellent 6.6% |
| Ottawa | 86.9 /100 | #134 | Excellent 6.6% |
| Tohono O'odham | 86.7 /100 | #135 | Excellent 6.6% |
| Luxembourgers | 86.4 /100 | #136 | Excellent 6.6% |
| French Canadians | 85.4 /100 | #137 | Excellent 6.6% |