Mongolian vs Assyrian/Chaldean/Syriac 4 or more Vehicles in Household
COMPARE
Mongolian
Assyrian/Chaldean/Syriac
4 or more Vehicles in Household
4 or more Vehicles in Household Comparison
Mongolians
Assyrians/Chaldeans/Syriacs
5.8%
4 OR MORE VEHICLES IN HOUSEHOLD
3.7/ 100
METRIC RATING
241st/ 347
METRIC RANK
7.2%
4 OR MORE VEHICLES IN HOUSEHOLD
99.4/ 100
METRIC RATING
91st/ 347
METRIC RANK
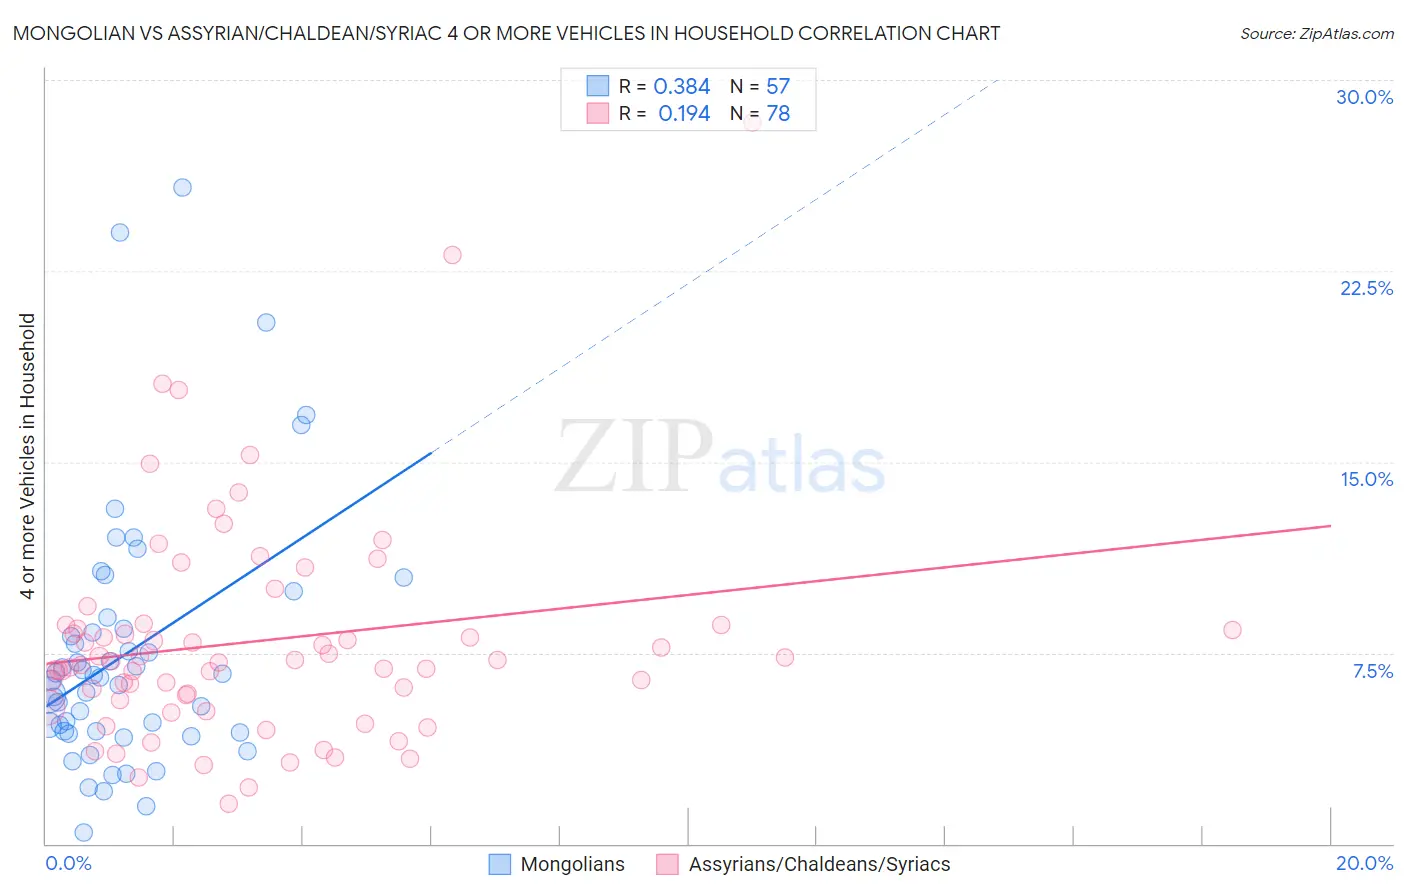
Mongolian vs Assyrian/Chaldean/Syriac 4 or more Vehicles in Household Correlation Chart
The statistical analysis conducted on geographies consisting of 139,675,009 people shows a mild positive correlation between the proportion of Mongolians and percentage of households with 4 or more vehicles available in the United States with a correlation coefficient (R) of 0.384 and weighted average of 5.8%. Similarly, the statistical analysis conducted on geographies consisting of 110,163,446 people shows a poor positive correlation between the proportion of Assyrians/Chaldeans/Syriacs and percentage of households with 4 or more vehicles available in the United States with a correlation coefficient (R) of 0.194 and weighted average of 7.2%, a difference of 23.3%.
4 or more Vehicles in Household Correlation Summary
| Measurement | Mongolian | Assyrian/Chaldean/Syriac |
| Minimum | 0.45% | 1.6% |
| Maximum | 25.8% | 28.3% |
| Range | 25.3% | 26.7% |
| Mean | 7.5% | 8.0% |
| Median | 6.5% | 7.1% |
| Interquartile 25% (IQ1) | 4.4% | 5.6% |
| Interquartile 75% (IQ3) | 8.7% | 8.6% |
| Interquartile Range (IQR) | 4.3% | 2.9% |
| Standard Deviation (Sample) | 5.1% | 4.4% |
| Standard Deviation (Population) | 5.0% | 4.4% |
Similar Demographics by 4 or more Vehicles in Household
Demographics Similar to Mongolians by 4 or more Vehicles in Household
In terms of 4 or more vehicles in household, the demographic groups most similar to Mongolians are Immigrants from Poland (5.8%, a difference of 0.090%), Immigrants from Australia (5.8%, a difference of 0.14%), Immigrants from Middle Africa (5.8%, a difference of 0.21%), Immigrants from Belgium (5.8%, a difference of 0.23%), and Turkish (5.8%, a difference of 0.35%).
| Demographics | Rating | Rank | 4 or more Vehicles in Household |
| Africans | 4.6 /100 | #234 | Tragic 5.8% |
| Immigrants | Hungary | 4.6 /100 | #235 | Tragic 5.8% |
| Immigrants | Eritrea | 4.5 /100 | #236 | Tragic 5.8% |
| Turks | 4.1 /100 | #237 | Tragic 5.8% |
| Immigrants | Belgium | 4.0 /100 | #238 | Tragic 5.8% |
| Immigrants | Australia | 3.8 /100 | #239 | Tragic 5.8% |
| Immigrants | Poland | 3.8 /100 | #240 | Tragic 5.8% |
| Mongolians | 3.7 /100 | #241 | Tragic 5.8% |
| Immigrants | Middle Africa | 3.4 /100 | #242 | Tragic 5.8% |
| Immigrants | Czechoslovakia | 3.2 /100 | #243 | Tragic 5.8% |
| Ethiopians | 3.2 /100 | #244 | Tragic 5.8% |
| Bulgarians | 3.1 /100 | #245 | Tragic 5.8% |
| Immigrants | North Macedonia | 2.5 /100 | #246 | Tragic 5.7% |
| Immigrants | Ethiopia | 2.4 /100 | #247 | Tragic 5.7% |
| Immigrants | Eastern Africa | 2.4 /100 | #248 | Tragic 5.7% |
Demographics Similar to Assyrians/Chaldeans/Syriacs by 4 or more Vehicles in Household
In terms of 4 or more vehicles in household, the demographic groups most similar to Assyrians/Chaldeans/Syriacs are Immigrants from Latin America (7.1%, a difference of 0.16%), Immigrants from Afghanistan (7.1%, a difference of 0.33%), Dutch West Indian (7.1%, a difference of 0.34%), Czechoslovakian (7.1%, a difference of 0.55%), and Creek (7.2%, a difference of 0.56%).
| Demographics | Rating | Rank | 4 or more Vehicles in Household |
| Afghans | 99.7 /100 | #84 | Exceptional 7.3% |
| Cree | 99.7 /100 | #85 | Exceptional 7.2% |
| Immigrants | Indonesia | 99.6 /100 | #86 | Exceptional 7.2% |
| Delaware | 99.6 /100 | #87 | Exceptional 7.2% |
| Immigrants | Nonimmigrants | 99.6 /100 | #88 | Exceptional 7.2% |
| British | 99.6 /100 | #89 | Exceptional 7.2% |
| Creek | 99.6 /100 | #90 | Exceptional 7.2% |
| Assyrians/Chaldeans/Syriacs | 99.4 /100 | #91 | Exceptional 7.2% |
| Immigrants | Latin America | 99.4 /100 | #92 | Exceptional 7.1% |
| Immigrants | Afghanistan | 99.3 /100 | #93 | Exceptional 7.1% |
| Dutch West Indians | 99.3 /100 | #94 | Exceptional 7.1% |
| Czechoslovakians | 99.3 /100 | #95 | Exceptional 7.1% |
| Central Americans | 99.3 /100 | #96 | Exceptional 7.1% |
| Celtics | 99.1 /100 | #97 | Exceptional 7.1% |
| Irish | 99.0 /100 | #98 | Exceptional 7.1% |