Immigrants from Czechoslovakia vs Jamaican 4 or more Vehicles in Household
COMPARE
Immigrants from Czechoslovakia
Jamaican
4 or more Vehicles in Household
4 or more Vehicles in Household Comparison
Immigrants from Czechoslovakia
Jamaicans
5.8%
4 OR MORE VEHICLES IN HOUSEHOLD
3.2/ 100
METRIC RATING
243rd/ 347
METRIC RANK
4.6%
4 OR MORE VEHICLES IN HOUSEHOLD
0.0/ 100
METRIC RATING
318th/ 347
METRIC RANK
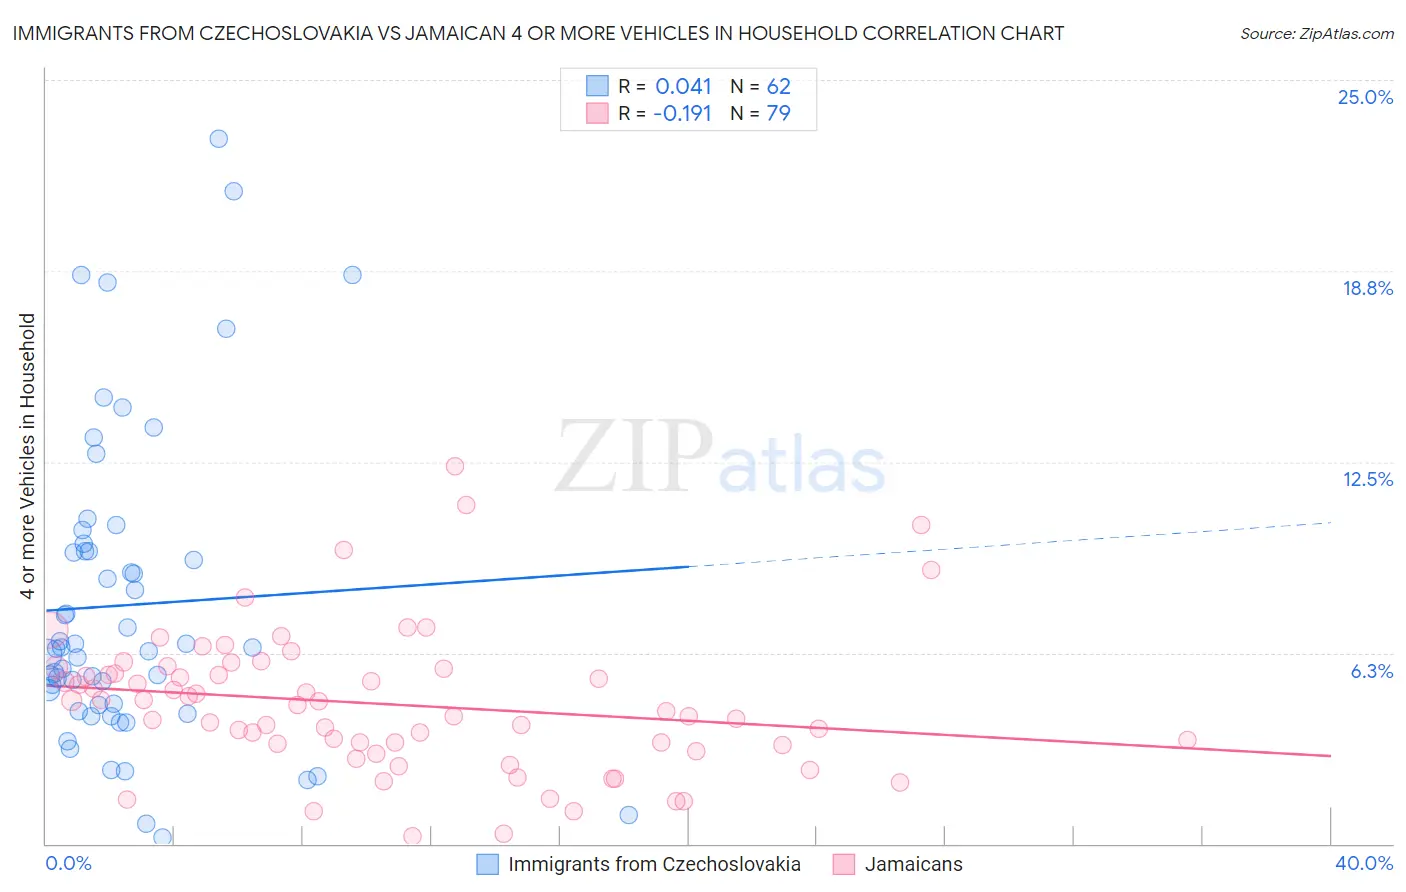
Immigrants from Czechoslovakia vs Jamaican 4 or more Vehicles in Household Correlation Chart
The statistical analysis conducted on geographies consisting of 194,652,046 people shows no correlation between the proportion of Immigrants from Czechoslovakia and percentage of households with 4 or more vehicles available in the United States with a correlation coefficient (R) of 0.041 and weighted average of 5.8%. Similarly, the statistical analysis conducted on geographies consisting of 366,007,173 people shows a poor negative correlation between the proportion of Jamaicans and percentage of households with 4 or more vehicles available in the United States with a correlation coefficient (R) of -0.191 and weighted average of 4.6%, a difference of 24.8%.
4 or more Vehicles in Household Correlation Summary
| Measurement | Immigrants from Czechoslovakia | Jamaican |
| Minimum | 0.19% | 0.24% |
| Maximum | 23.1% | 12.3% |
| Range | 22.9% | 12.1% |
| Mean | 7.8% | 4.6% |
| Median | 6.4% | 4.5% |
| Interquartile 25% (IQ1) | 4.5% | 3.2% |
| Interquartile 75% (IQ3) | 9.6% | 5.7% |
| Interquartile Range (IQR) | 5.1% | 2.5% |
| Standard Deviation (Sample) | 5.1% | 2.3% |
| Standard Deviation (Population) | 5.0% | 2.3% |
Similar Demographics by 4 or more Vehicles in Household
Demographics Similar to Immigrants from Czechoslovakia by 4 or more Vehicles in Household
In terms of 4 or more vehicles in household, the demographic groups most similar to Immigrants from Czechoslovakia are Ethiopian (5.8%, a difference of 0.010%), Bulgarian (5.8%, a difference of 0.050%), Immigrants from Middle Africa (5.8%, a difference of 0.19%), Mongolian (5.8%, a difference of 0.40%), and Immigrants from Poland (5.8%, a difference of 0.49%).
| Demographics | Rating | Rank | 4 or more Vehicles in Household |
| Immigrants | Eritrea | 4.5 /100 | #236 | Tragic 5.8% |
| Turks | 4.1 /100 | #237 | Tragic 5.8% |
| Immigrants | Belgium | 4.0 /100 | #238 | Tragic 5.8% |
| Immigrants | Australia | 3.8 /100 | #239 | Tragic 5.8% |
| Immigrants | Poland | 3.8 /100 | #240 | Tragic 5.8% |
| Mongolians | 3.7 /100 | #241 | Tragic 5.8% |
| Immigrants | Middle Africa | 3.4 /100 | #242 | Tragic 5.8% |
| Immigrants | Czechoslovakia | 3.2 /100 | #243 | Tragic 5.8% |
| Ethiopians | 3.2 /100 | #244 | Tragic 5.8% |
| Bulgarians | 3.1 /100 | #245 | Tragic 5.8% |
| Immigrants | North Macedonia | 2.5 /100 | #246 | Tragic 5.7% |
| Immigrants | Ethiopia | 2.4 /100 | #247 | Tragic 5.7% |
| Immigrants | Eastern Africa | 2.4 /100 | #248 | Tragic 5.7% |
| Immigrants | Southern Europe | 2.3 /100 | #249 | Tragic 5.7% |
| Immigrants | Europe | 2.3 /100 | #250 | Tragic 5.7% |
Demographics Similar to Jamaicans by 4 or more Vehicles in Household
In terms of 4 or more vehicles in household, the demographic groups most similar to Jamaicans are U.S. Virgin Islander (4.6%, a difference of 0.24%), Haitian (4.6%, a difference of 0.65%), Puerto Rican (4.7%, a difference of 1.9%), Immigrants from Belarus (4.7%, a difference of 2.4%), and Immigrants from West Indies (4.7%, a difference of 2.5%).
| Demographics | Rating | Rank | 4 or more Vehicles in Household |
| Houma | 0.0 /100 | #311 | Tragic 4.9% |
| Albanians | 0.0 /100 | #312 | Tragic 4.8% |
| Immigrants | Israel | 0.0 /100 | #313 | Tragic 4.8% |
| Immigrants | West Indies | 0.0 /100 | #314 | Tragic 4.7% |
| Immigrants | Belarus | 0.0 /100 | #315 | Tragic 4.7% |
| Puerto Ricans | 0.0 /100 | #316 | Tragic 4.7% |
| U.S. Virgin Islanders | 0.0 /100 | #317 | Tragic 4.6% |
| Jamaicans | 0.0 /100 | #318 | Tragic 4.6% |
| Haitians | 0.0 /100 | #319 | Tragic 4.6% |
| Immigrants | Haiti | 0.0 /100 | #320 | Tragic 4.5% |
| Ecuadorians | 0.0 /100 | #321 | Tragic 4.5% |
| Immigrants | Yemen | 0.0 /100 | #322 | Tragic 4.5% |
| Immigrants | Caribbean | 0.0 /100 | #323 | Tragic 4.4% |
| Soviet Union | 0.0 /100 | #324 | Tragic 4.4% |
| Immigrants | Jamaica | 0.0 /100 | #325 | Tragic 4.4% |