Mongolian vs Ukrainian 4 or more Vehicles in Household
COMPARE
Mongolian
Ukrainian
4 or more Vehicles in Household
4 or more Vehicles in Household Comparison
Mongolians
Ukrainians
5.8%
4 OR MORE VEHICLES IN HOUSEHOLD
3.7/ 100
METRIC RATING
241st/ 347
METRIC RANK
6.3%
4 OR MORE VEHICLES IN HOUSEHOLD
47.6/ 100
METRIC RATING
176th/ 347
METRIC RANK
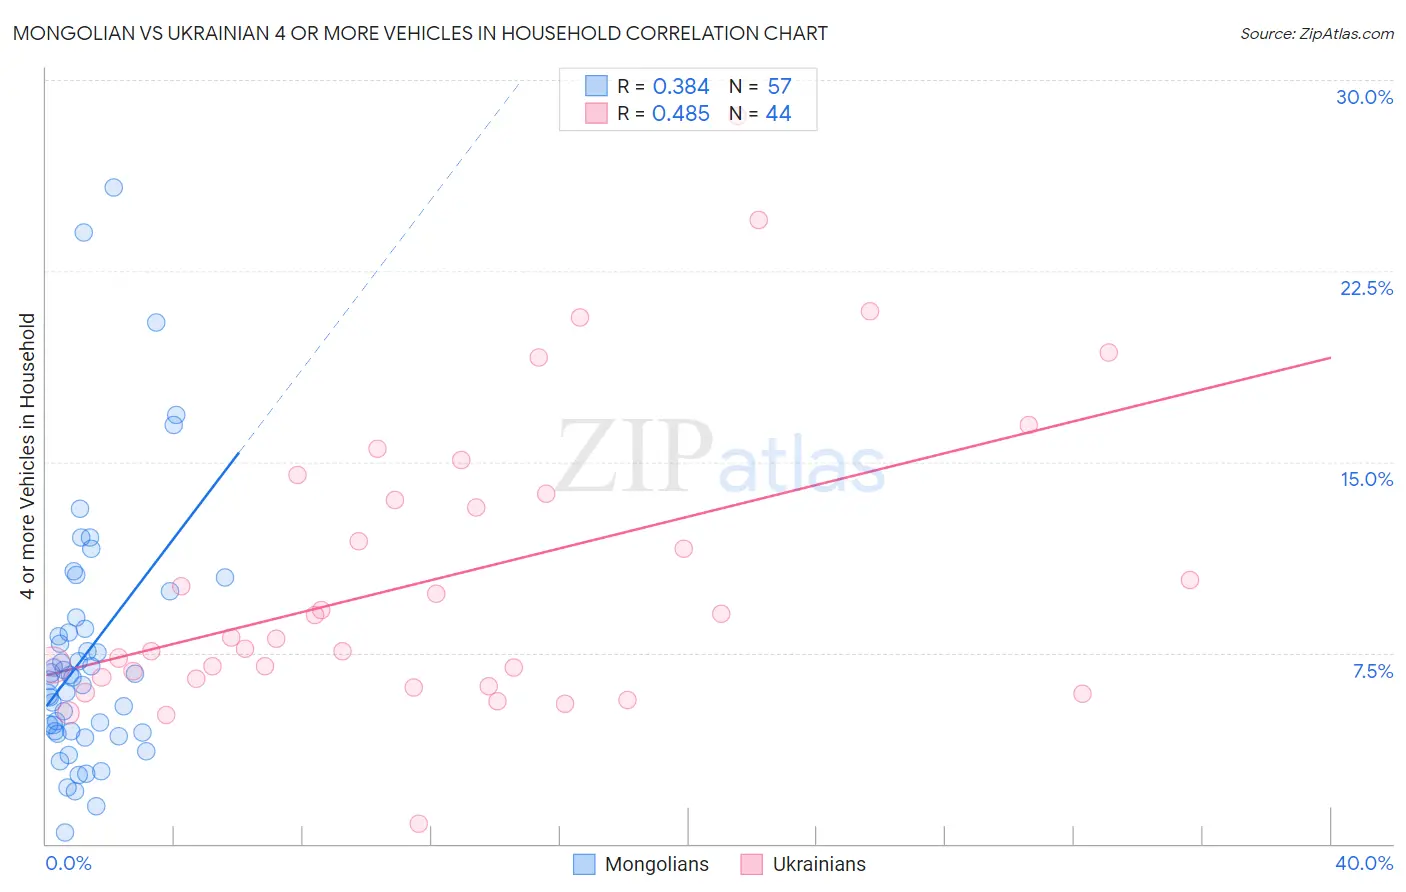
Mongolian vs Ukrainian 4 or more Vehicles in Household Correlation Chart
The statistical analysis conducted on geographies consisting of 139,675,009 people shows a mild positive correlation between the proportion of Mongolians and percentage of households with 4 or more vehicles available in the United States with a correlation coefficient (R) of 0.384 and weighted average of 5.8%. Similarly, the statistical analysis conducted on geographies consisting of 446,444,897 people shows a moderate positive correlation between the proportion of Ukrainians and percentage of households with 4 or more vehicles available in the United States with a correlation coefficient (R) of 0.485 and weighted average of 6.3%, a difference of 8.8%.
4 or more Vehicles in Household Correlation Summary
| Measurement | Mongolian | Ukrainian |
| Minimum | 0.45% | 0.81% |
| Maximum | 25.8% | 28.6% |
| Range | 25.3% | 27.8% |
| Mean | 7.5% | 10.5% |
| Median | 6.5% | 8.1% |
| Interquartile 25% (IQ1) | 4.4% | 6.5% |
| Interquartile 75% (IQ3) | 8.7% | 13.6% |
| Interquartile Range (IQR) | 4.3% | 7.1% |
| Standard Deviation (Sample) | 5.1% | 5.8% |
| Standard Deviation (Population) | 5.0% | 5.8% |
Similar Demographics by 4 or more Vehicles in Household
Demographics Similar to Mongolians by 4 or more Vehicles in Household
In terms of 4 or more vehicles in household, the demographic groups most similar to Mongolians are Immigrants from Poland (5.8%, a difference of 0.090%), Immigrants from Australia (5.8%, a difference of 0.14%), Immigrants from Middle Africa (5.8%, a difference of 0.21%), Immigrants from Belgium (5.8%, a difference of 0.23%), and Turkish (5.8%, a difference of 0.35%).
| Demographics | Rating | Rank | 4 or more Vehicles in Household |
| Africans | 4.6 /100 | #234 | Tragic 5.8% |
| Immigrants | Hungary | 4.6 /100 | #235 | Tragic 5.8% |
| Immigrants | Eritrea | 4.5 /100 | #236 | Tragic 5.8% |
| Turks | 4.1 /100 | #237 | Tragic 5.8% |
| Immigrants | Belgium | 4.0 /100 | #238 | Tragic 5.8% |
| Immigrants | Australia | 3.8 /100 | #239 | Tragic 5.8% |
| Immigrants | Poland | 3.8 /100 | #240 | Tragic 5.8% |
| Mongolians | 3.7 /100 | #241 | Tragic 5.8% |
| Immigrants | Middle Africa | 3.4 /100 | #242 | Tragic 5.8% |
| Immigrants | Czechoslovakia | 3.2 /100 | #243 | Tragic 5.8% |
| Ethiopians | 3.2 /100 | #244 | Tragic 5.8% |
| Bulgarians | 3.1 /100 | #245 | Tragic 5.8% |
| Immigrants | North Macedonia | 2.5 /100 | #246 | Tragic 5.7% |
| Immigrants | Ethiopia | 2.4 /100 | #247 | Tragic 5.7% |
| Immigrants | Eastern Africa | 2.4 /100 | #248 | Tragic 5.7% |
Demographics Similar to Ukrainians by 4 or more Vehicles in Household
In terms of 4 or more vehicles in household, the demographic groups most similar to Ukrainians are Slovak (6.3%, a difference of 0.070%), Immigrants from Western Europe (6.3%, a difference of 0.12%), Lithuanian (6.3%, a difference of 0.24%), Belizean (6.3%, a difference of 0.31%), and Slovene (6.3%, a difference of 0.36%).
| Demographics | Rating | Rank | 4 or more Vehicles in Household |
| Estonians | 55.1 /100 | #169 | Average 6.4% |
| Immigrants | Syria | 52.8 /100 | #170 | Average 6.3% |
| Immigrants | India | 51.9 /100 | #171 | Average 6.3% |
| Immigrants | Lebanon | 51.7 /100 | #172 | Average 6.3% |
| Slovenes | 51.1 /100 | #173 | Average 6.3% |
| Lithuanians | 50.0 /100 | #174 | Average 6.3% |
| Immigrants | Western Europe | 48.8 /100 | #175 | Average 6.3% |
| Ukrainians | 47.6 /100 | #176 | Average 6.3% |
| Slovaks | 46.9 /100 | #177 | Average 6.3% |
| Belizeans | 44.5 /100 | #178 | Average 6.3% |
| Immigrants | Japan | 43.1 /100 | #179 | Average 6.3% |
| Syrians | 42.0 /100 | #180 | Average 6.3% |
| Yugoslavians | 41.1 /100 | #181 | Average 6.3% |
| South American Indians | 40.7 /100 | #182 | Average 6.3% |
| Immigrants | Burma/Myanmar | 37.5 /100 | #183 | Fair 6.2% |