Immigrants from Russia vs Jamaican 4 or more Vehicles in Household
COMPARE
Immigrants from Russia
Jamaican
4 or more Vehicles in Household
4 or more Vehicles in Household Comparison
Immigrants from Russia
Jamaicans
5.3%
4 OR MORE VEHICLES IN HOUSEHOLD
0.2/ 100
METRIC RATING
290th/ 347
METRIC RANK
4.6%
4 OR MORE VEHICLES IN HOUSEHOLD
0.0/ 100
METRIC RATING
318th/ 347
METRIC RANK
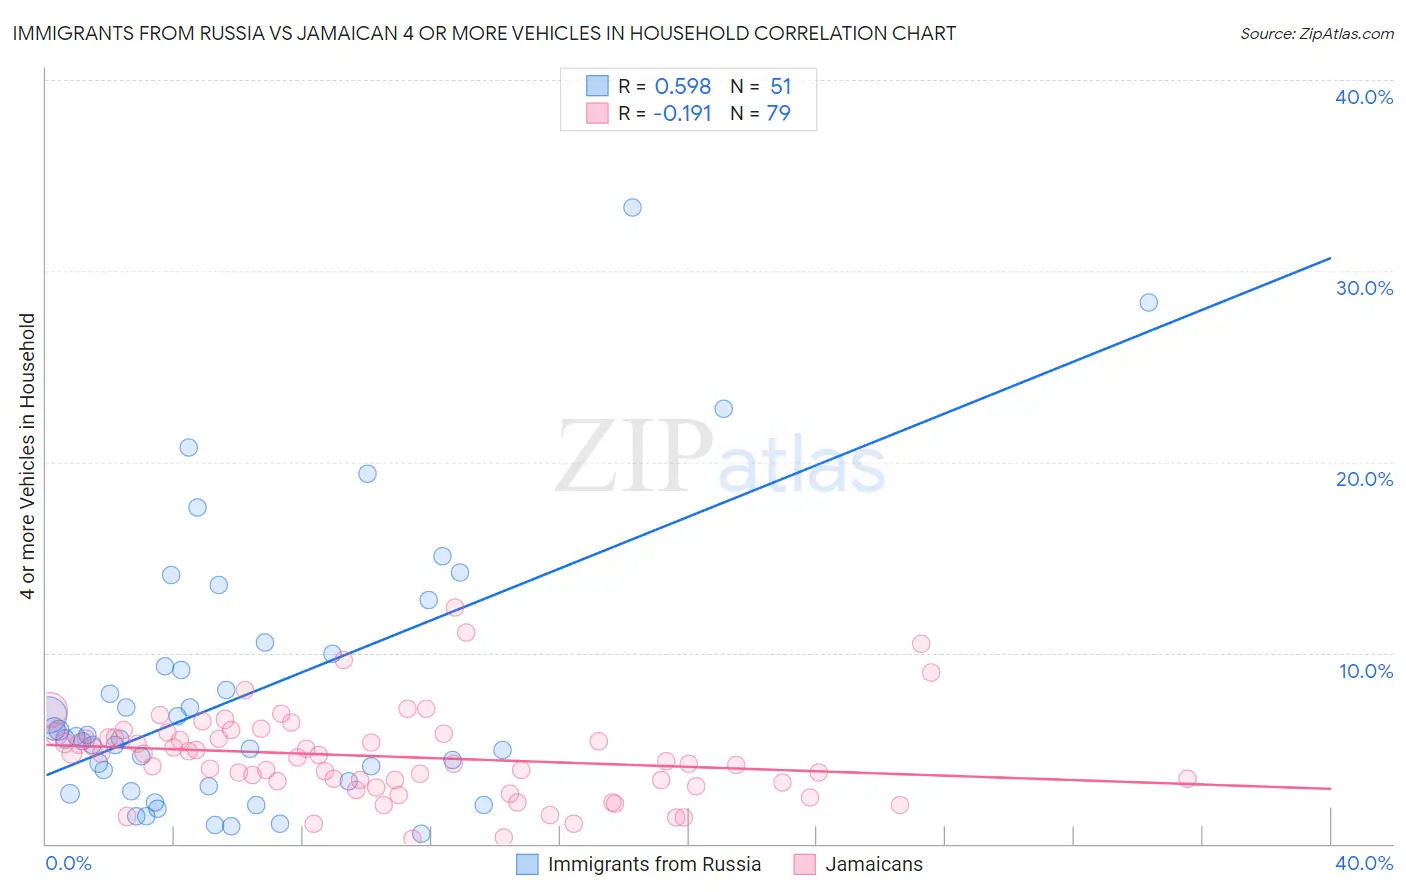
Immigrants from Russia vs Jamaican 4 or more Vehicles in Household Correlation Chart
The statistical analysis conducted on geographies consisting of 346,141,133 people shows a substantial positive correlation between the proportion of Immigrants from Russia and percentage of households with 4 or more vehicles available in the United States with a correlation coefficient (R) of 0.598 and weighted average of 5.3%. Similarly, the statistical analysis conducted on geographies consisting of 366,007,173 people shows a poor negative correlation between the proportion of Jamaicans and percentage of households with 4 or more vehicles available in the United States with a correlation coefficient (R) of -0.191 and weighted average of 4.6%, a difference of 14.8%.
4 or more Vehicles in Household Correlation Summary
| Measurement | Immigrants from Russia | Jamaican |
| Minimum | 0.50% | 0.24% |
| Maximum | 33.3% | 12.3% |
| Range | 32.8% | 12.1% |
| Mean | 7.9% | 4.6% |
| Median | 5.5% | 4.5% |
| Interquartile 25% (IQ1) | 3.0% | 3.2% |
| Interquartile 75% (IQ3) | 9.9% | 5.7% |
| Interquartile Range (IQR) | 6.9% | 2.5% |
| Standard Deviation (Sample) | 7.1% | 2.3% |
| Standard Deviation (Population) | 7.1% | 2.3% |
Similar Demographics by 4 or more Vehicles in Household
Demographics Similar to Immigrants from Russia by 4 or more Vehicles in Household
In terms of 4 or more vehicles in household, the demographic groups most similar to Immigrants from Russia are Immigrants from Bosnia and Herzegovina (5.3%, a difference of 0.30%), Venezuelan (5.3%, a difference of 0.44%), Immigrants from Croatia (5.4%, a difference of 0.63%), Immigrants from Colombia (5.4%, a difference of 0.72%), and Immigrants from Liberia (5.4%, a difference of 0.76%).
| Demographics | Rating | Rank | 4 or more Vehicles in Household |
| Immigrants | Ireland | 0.3 /100 | #283 | Tragic 5.4% |
| Brazilians | 0.3 /100 | #284 | Tragic 5.4% |
| Immigrants | Liberia | 0.2 /100 | #285 | Tragic 5.4% |
| Immigrants | Colombia | 0.2 /100 | #286 | Tragic 5.4% |
| Immigrants | Croatia | 0.2 /100 | #287 | Tragic 5.4% |
| Venezuelans | 0.2 /100 | #288 | Tragic 5.3% |
| Immigrants | Bosnia and Herzegovina | 0.2 /100 | #289 | Tragic 5.3% |
| Immigrants | Russia | 0.2 /100 | #290 | Tragic 5.3% |
| Immigrants | Bahamas | 0.1 /100 | #291 | Tragic 5.3% |
| Liberians | 0.1 /100 | #292 | Tragic 5.3% |
| Immigrants | Congo | 0.1 /100 | #293 | Tragic 5.2% |
| Ghanaians | 0.1 /100 | #294 | Tragic 5.2% |
| Immigrants | Brazil | 0.1 /100 | #295 | Tragic 5.2% |
| Israelis | 0.1 /100 | #296 | Tragic 5.2% |
| Immigrants | Venezuela | 0.1 /100 | #297 | Tragic 5.2% |
Demographics Similar to Jamaicans by 4 or more Vehicles in Household
In terms of 4 or more vehicles in household, the demographic groups most similar to Jamaicans are U.S. Virgin Islander (4.6%, a difference of 0.24%), Haitian (4.6%, a difference of 0.65%), Puerto Rican (4.7%, a difference of 1.9%), Immigrants from Belarus (4.7%, a difference of 2.4%), and Immigrants from West Indies (4.7%, a difference of 2.5%).
| Demographics | Rating | Rank | 4 or more Vehicles in Household |
| Houma | 0.0 /100 | #311 | Tragic 4.9% |
| Albanians | 0.0 /100 | #312 | Tragic 4.8% |
| Immigrants | Israel | 0.0 /100 | #313 | Tragic 4.8% |
| Immigrants | West Indies | 0.0 /100 | #314 | Tragic 4.7% |
| Immigrants | Belarus | 0.0 /100 | #315 | Tragic 4.7% |
| Puerto Ricans | 0.0 /100 | #316 | Tragic 4.7% |
| U.S. Virgin Islanders | 0.0 /100 | #317 | Tragic 4.6% |
| Jamaicans | 0.0 /100 | #318 | Tragic 4.6% |
| Haitians | 0.0 /100 | #319 | Tragic 4.6% |
| Immigrants | Haiti | 0.0 /100 | #320 | Tragic 4.5% |
| Ecuadorians | 0.0 /100 | #321 | Tragic 4.5% |
| Immigrants | Yemen | 0.0 /100 | #322 | Tragic 4.5% |
| Immigrants | Caribbean | 0.0 /100 | #323 | Tragic 4.4% |
| Soviet Union | 0.0 /100 | #324 | Tragic 4.4% |
| Immigrants | Jamaica | 0.0 /100 | #325 | Tragic 4.4% |