Mongolian vs Jamaican Professional Degree
COMPARE
Mongolian
Jamaican
Professional Degree
Professional Degree Comparison
Mongolians
Jamaicans
6.1%
PROFESSIONAL DEGREE
100.0/ 100
METRIC RATING
34th/ 347
METRIC RANK
3.7%
PROFESSIONAL DEGREE
1.4/ 100
METRIC RATING
252nd/ 347
METRIC RANK
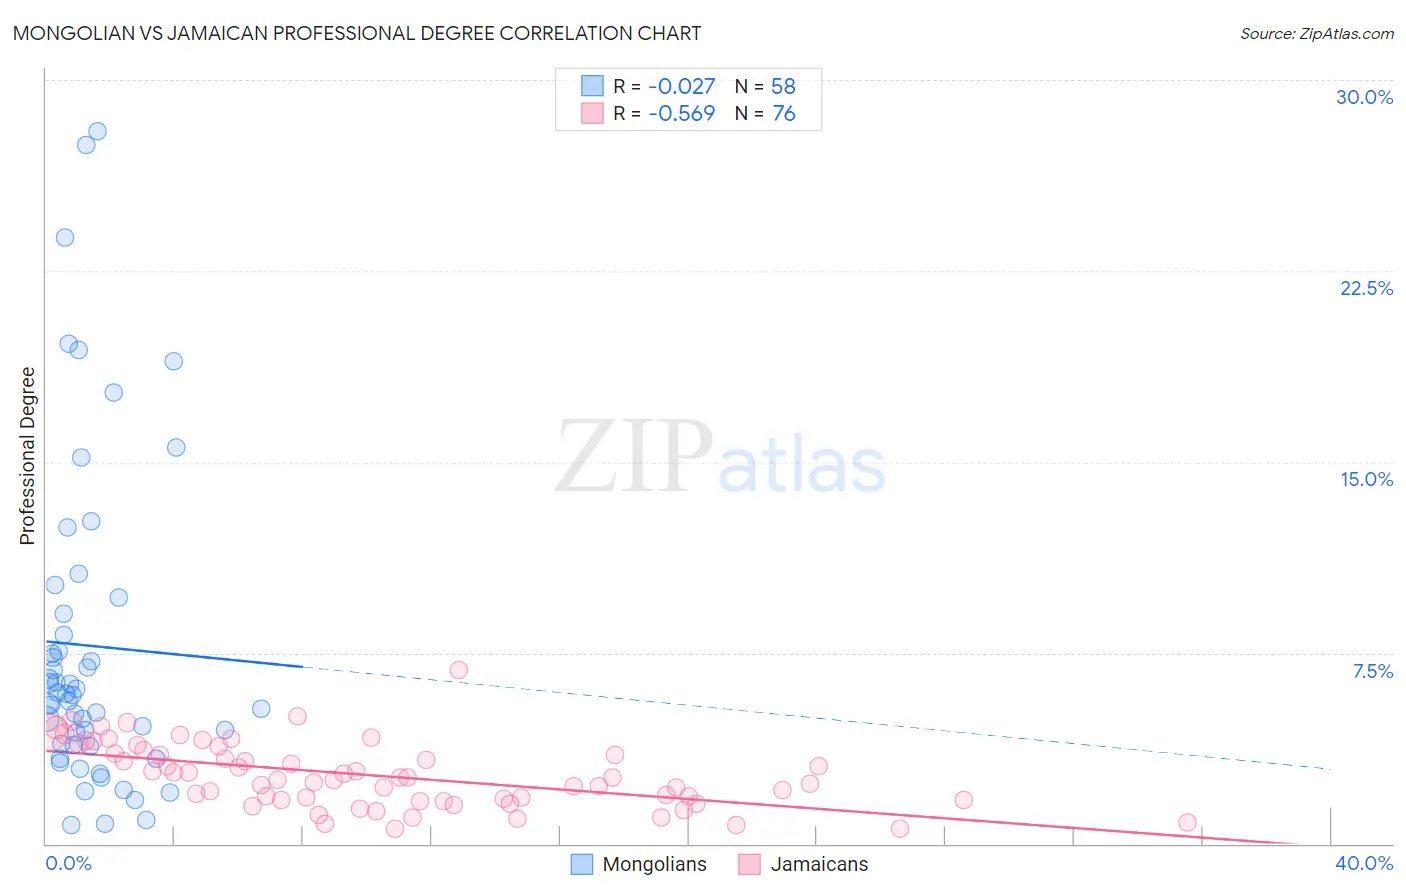
Mongolian vs Jamaican Professional Degree Correlation Chart
The statistical analysis conducted on geographies consisting of 140,296,057 people shows no correlation between the proportion of Mongolians and percentage of population with at least professional degree education in the United States with a correlation coefficient (R) of -0.027 and weighted average of 6.1%. Similarly, the statistical analysis conducted on geographies consisting of 367,101,955 people shows a substantial negative correlation between the proportion of Jamaicans and percentage of population with at least professional degree education in the United States with a correlation coefficient (R) of -0.569 and weighted average of 3.7%, a difference of 64.7%.
Professional Degree Correlation Summary
| Measurement | Mongolian | Jamaican |
| Minimum | 0.72% | 0.59% |
| Maximum | 28.0% | 6.8% |
| Range | 27.3% | 6.2% |
| Mean | 7.8% | 2.7% |
| Median | 5.9% | 2.5% |
| Interquartile 25% (IQ1) | 3.9% | 1.7% |
| Interquartile 75% (IQ3) | 9.0% | 3.6% |
| Interquartile Range (IQR) | 5.1% | 1.9% |
| Standard Deviation (Sample) | 6.4% | 1.3% |
| Standard Deviation (Population) | 6.3% | 1.3% |
Similar Demographics by Professional Degree
Demographics Similar to Mongolians by Professional Degree
In terms of professional degree, the demographic groups most similar to Mongolians are Burmese (6.1%, a difference of 0.13%), Thai (6.1%, a difference of 0.17%), Immigrants from India (6.2%, a difference of 0.40%), Immigrants from Sri Lanka (6.2%, a difference of 0.52%), and Immigrants from Turkey (6.2%, a difference of 0.52%).
| Demographics | Rating | Rank | Professional Degree |
| Immigrants | Northern Europe | 100.0 /100 | #27 | Exceptional 6.2% |
| Turks | 100.0 /100 | #28 | Exceptional 6.2% |
| Immigrants | Sri Lanka | 100.0 /100 | #29 | Exceptional 6.2% |
| Immigrants | Turkey | 100.0 /100 | #30 | Exceptional 6.2% |
| Immigrants | India | 100.0 /100 | #31 | Exceptional 6.2% |
| Thais | 100.0 /100 | #32 | Exceptional 6.1% |
| Burmese | 100.0 /100 | #33 | Exceptional 6.1% |
| Mongolians | 100.0 /100 | #34 | Exceptional 6.1% |
| Immigrants | Korea | 100.0 /100 | #35 | Exceptional 6.1% |
| Immigrants | Russia | 100.0 /100 | #36 | Exceptional 6.0% |
| Immigrants | Austria | 100.0 /100 | #37 | Exceptional 6.0% |
| Immigrants | Norway | 100.0 /100 | #38 | Exceptional 6.0% |
| Immigrants | South Africa | 100.0 /100 | #39 | Exceptional 6.0% |
| Cambodians | 100.0 /100 | #40 | Exceptional 6.0% |
| New Zealanders | 100.0 /100 | #41 | Exceptional 6.0% |
Demographics Similar to Jamaicans by Professional Degree
In terms of professional degree, the demographic groups most similar to Jamaicans are Pueblo (3.7%, a difference of 0.10%), Immigrants from Nicaragua (3.7%, a difference of 0.14%), Tongan (3.7%, a difference of 0.24%), Immigrants from Fiji (3.7%, a difference of 0.39%), and Immigrants from Grenada (3.7%, a difference of 0.46%).
| Demographics | Rating | Rank | Professional Degree |
| French American Indians | 1.7 /100 | #245 | Tragic 3.8% |
| Marshallese | 1.7 /100 | #246 | Tragic 3.8% |
| Guyanese | 1.6 /100 | #247 | Tragic 3.8% |
| Hmong | 1.6 /100 | #248 | Tragic 3.7% |
| Immigrants | Grenada | 1.5 /100 | #249 | Tragic 3.7% |
| Immigrants | Fiji | 1.5 /100 | #250 | Tragic 3.7% |
| Immigrants | Nicaragua | 1.4 /100 | #251 | Tragic 3.7% |
| Jamaicans | 1.4 /100 | #252 | Tragic 3.7% |
| Pueblo | 1.4 /100 | #253 | Tragic 3.7% |
| Tongans | 1.3 /100 | #254 | Tragic 3.7% |
| Osage | 1.2 /100 | #255 | Tragic 3.7% |
| Iroquois | 1.2 /100 | #256 | Tragic 3.7% |
| Bahamians | 1.1 /100 | #257 | Tragic 3.7% |
| Immigrants | St. Vincent and the Grenadines | 1.1 /100 | #258 | Tragic 3.7% |
| Africans | 1.0 /100 | #259 | Tragic 3.7% |