Apache vs Jamaican 4 or more Vehicles in Household
COMPARE
Apache
Jamaican
4 or more Vehicles in Household
4 or more Vehicles in Household Comparison
Apache
Jamaicans
7.4%
4 OR MORE VEHICLES IN HOUSEHOLD
99.9/ 100
METRIC RATING
77th/ 347
METRIC RANK
4.6%
4 OR MORE VEHICLES IN HOUSEHOLD
0.0/ 100
METRIC RATING
318th/ 347
METRIC RANK
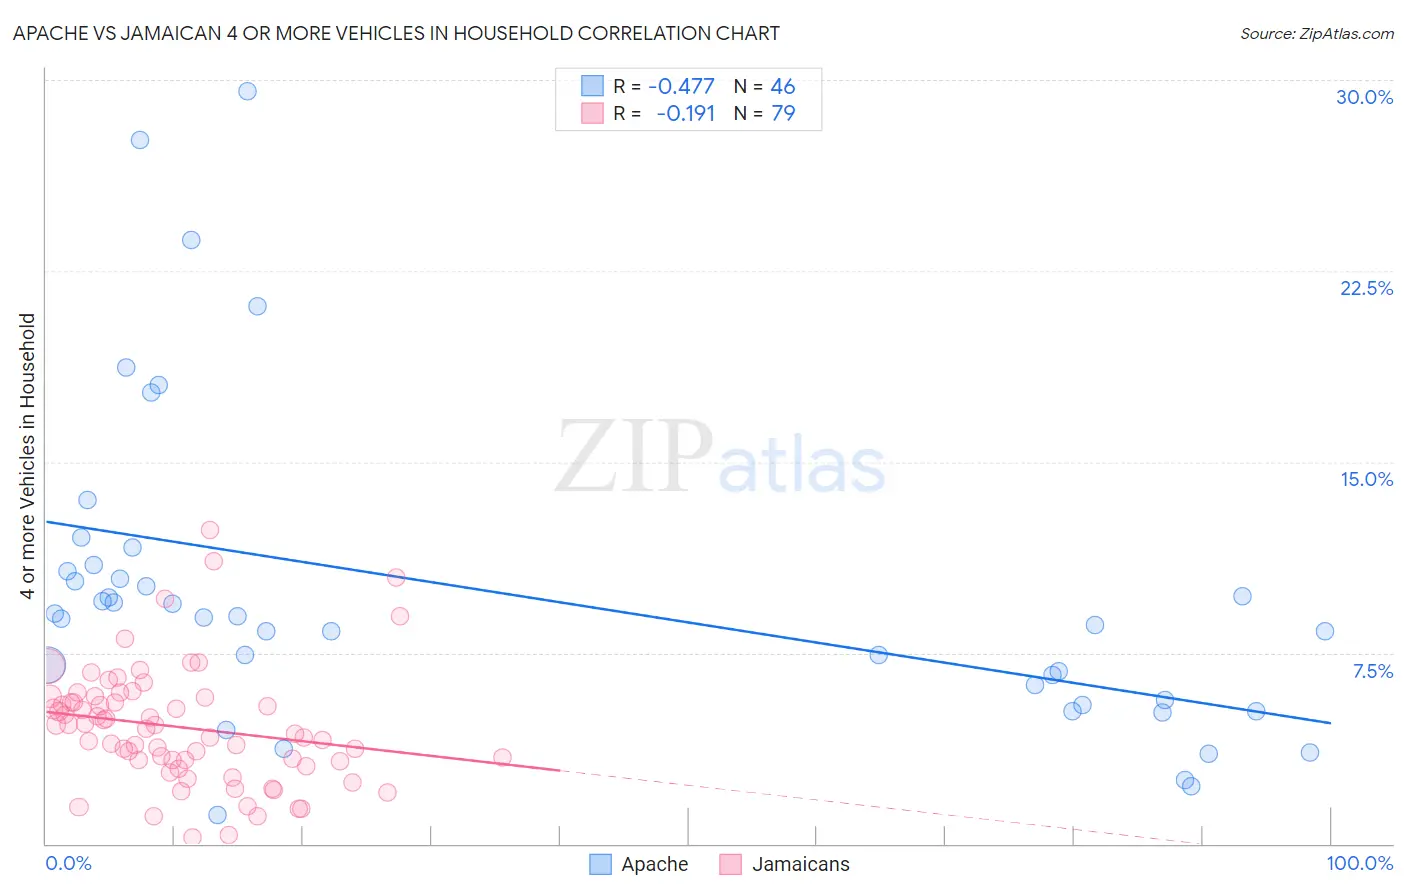
Apache vs Jamaican 4 or more Vehicles in Household Correlation Chart
The statistical analysis conducted on geographies consisting of 230,812,683 people shows a moderate negative correlation between the proportion of Apache and percentage of households with 4 or more vehicles available in the United States with a correlation coefficient (R) of -0.477 and weighted average of 7.4%. Similarly, the statistical analysis conducted on geographies consisting of 366,007,173 people shows a poor negative correlation between the proportion of Jamaicans and percentage of households with 4 or more vehicles available in the United States with a correlation coefficient (R) of -0.191 and weighted average of 4.6%, a difference of 59.1%.
4 or more Vehicles in Household Correlation Summary
| Measurement | Apache | Jamaican |
| Minimum | 1.1% | 0.24% |
| Maximum | 29.6% | 12.3% |
| Range | 28.5% | 12.1% |
| Mean | 9.8% | 4.6% |
| Median | 8.9% | 4.5% |
| Interquartile 25% (IQ1) | 5.6% | 3.2% |
| Interquartile 75% (IQ3) | 10.7% | 5.7% |
| Interquartile Range (IQR) | 5.1% | 2.5% |
| Standard Deviation (Sample) | 6.2% | 2.3% |
| Standard Deviation (Population) | 6.2% | 2.3% |
Similar Demographics by 4 or more Vehicles in Household
Demographics Similar to Apache by 4 or more Vehicles in Household
In terms of 4 or more vehicles in household, the demographic groups most similar to Apache are White/Caucasian (7.4%, a difference of 0.060%), Laotian (7.4%, a difference of 0.17%), Icelander (7.4%, a difference of 0.22%), Immigrants from Cambodia (7.4%, a difference of 0.22%), and Czech (7.4%, a difference of 0.24%).
| Demographics | Rating | Rank | 4 or more Vehicles in Household |
| Scottish | 99.9 /100 | #70 | Exceptional 7.4% |
| Chickasaw | 99.9 /100 | #71 | Exceptional 7.4% |
| Scotch-Irish | 99.9 /100 | #72 | Exceptional 7.4% |
| Portuguese | 99.9 /100 | #73 | Exceptional 7.4% |
| Icelanders | 99.9 /100 | #74 | Exceptional 7.4% |
| Immigrants | Cambodia | 99.9 /100 | #75 | Exceptional 7.4% |
| Laotians | 99.9 /100 | #76 | Exceptional 7.4% |
| Apache | 99.9 /100 | #77 | Exceptional 7.4% |
| Whites/Caucasians | 99.8 /100 | #78 | Exceptional 7.4% |
| Czechs | 99.8 /100 | #79 | Exceptional 7.4% |
| Alaska Natives | 99.8 /100 | #80 | Exceptional 7.3% |
| Finns | 99.8 /100 | #81 | Exceptional 7.3% |
| Northern Europeans | 99.8 /100 | #82 | Exceptional 7.3% |
| Potawatomi | 99.7 /100 | #83 | Exceptional 7.3% |
| Afghans | 99.7 /100 | #84 | Exceptional 7.3% |
Demographics Similar to Jamaicans by 4 or more Vehicles in Household
In terms of 4 or more vehicles in household, the demographic groups most similar to Jamaicans are U.S. Virgin Islander (4.6%, a difference of 0.24%), Haitian (4.6%, a difference of 0.65%), Puerto Rican (4.7%, a difference of 1.9%), Immigrants from Belarus (4.7%, a difference of 2.4%), and Immigrants from West Indies (4.7%, a difference of 2.5%).
| Demographics | Rating | Rank | 4 or more Vehicles in Household |
| Houma | 0.0 /100 | #311 | Tragic 4.9% |
| Albanians | 0.0 /100 | #312 | Tragic 4.8% |
| Immigrants | Israel | 0.0 /100 | #313 | Tragic 4.8% |
| Immigrants | West Indies | 0.0 /100 | #314 | Tragic 4.7% |
| Immigrants | Belarus | 0.0 /100 | #315 | Tragic 4.7% |
| Puerto Ricans | 0.0 /100 | #316 | Tragic 4.7% |
| U.S. Virgin Islanders | 0.0 /100 | #317 | Tragic 4.6% |
| Jamaicans | 0.0 /100 | #318 | Tragic 4.6% |
| Haitians | 0.0 /100 | #319 | Tragic 4.6% |
| Immigrants | Haiti | 0.0 /100 | #320 | Tragic 4.5% |
| Ecuadorians | 0.0 /100 | #321 | Tragic 4.5% |
| Immigrants | Yemen | 0.0 /100 | #322 | Tragic 4.5% |
| Immigrants | Caribbean | 0.0 /100 | #323 | Tragic 4.4% |
| Soviet Union | 0.0 /100 | #324 | Tragic 4.4% |
| Immigrants | Jamaica | 0.0 /100 | #325 | Tragic 4.4% |