Chickasaw vs Assyrian/Chaldean/Syriac 4 or more Vehicles in Household
COMPARE
Chickasaw
Assyrian/Chaldean/Syriac
4 or more Vehicles in Household
4 or more Vehicles in Household Comparison
Chickasaw
Assyrians/Chaldeans/Syriacs
7.4%
4 OR MORE VEHICLES IN HOUSEHOLD
99.9/ 100
METRIC RATING
71st/ 347
METRIC RANK
7.2%
4 OR MORE VEHICLES IN HOUSEHOLD
99.4/ 100
METRIC RATING
91st/ 347
METRIC RANK
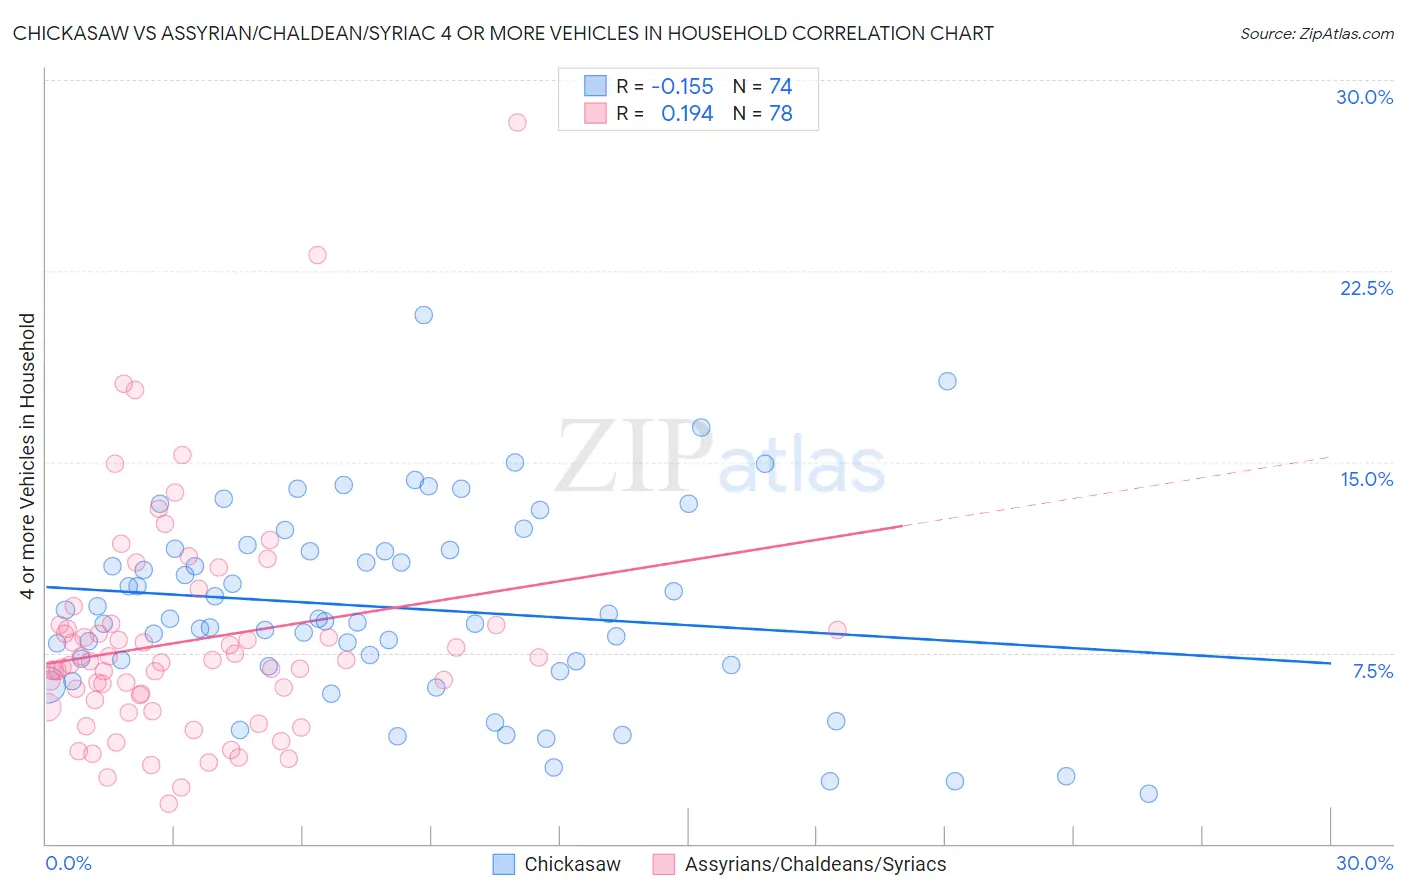
Chickasaw vs Assyrian/Chaldean/Syriac 4 or more Vehicles in Household Correlation Chart
The statistical analysis conducted on geographies consisting of 147,524,339 people shows a poor negative correlation between the proportion of Chickasaw and percentage of households with 4 or more vehicles available in the United States with a correlation coefficient (R) of -0.155 and weighted average of 7.4%. Similarly, the statistical analysis conducted on geographies consisting of 110,163,446 people shows a poor positive correlation between the proportion of Assyrians/Chaldeans/Syriacs and percentage of households with 4 or more vehicles available in the United States with a correlation coefficient (R) of 0.194 and weighted average of 7.2%, a difference of 4.0%.
4 or more Vehicles in Household Correlation Summary
| Measurement | Chickasaw | Assyrian/Chaldean/Syriac |
| Minimum | 2.0% | 1.6% |
| Maximum | 20.8% | 28.3% |
| Range | 18.8% | 26.7% |
| Mean | 9.3% | 8.0% |
| Median | 8.8% | 7.1% |
| Interquartile 25% (IQ1) | 7.0% | 5.6% |
| Interquartile 75% (IQ3) | 11.5% | 8.6% |
| Interquartile Range (IQR) | 4.5% | 2.9% |
| Standard Deviation (Sample) | 3.8% | 4.4% |
| Standard Deviation (Population) | 3.8% | 4.4% |
Demographics Similar to Chickasaw and Assyrians/Chaldeans/Syriacs by 4 or more Vehicles in Household
In terms of 4 or more vehicles in household, the demographic groups most similar to Chickasaw are Scotch-Irish (7.4%, a difference of 0.30%), Portuguese (7.4%, a difference of 0.39%), Icelander (7.4%, a difference of 0.69%), Immigrants from Cambodia (7.4%, a difference of 0.70%), and Laotian (7.4%, a difference of 0.75%). Similarly, the demographic groups most similar to Assyrians/Chaldeans/Syriacs are Creek (7.2%, a difference of 0.56%), British (7.2%, a difference of 0.65%), Nonimmigrants (7.2%, a difference of 0.98%), Delaware (7.2%, a difference of 1.0%), and Immigrants from Indonesia (7.2%, a difference of 1.1%).
| Demographics | Rating | Rank | 4 or more Vehicles in Household |
| Chickasaw | 99.9 /100 | #71 | Exceptional 7.4% |
| Scotch-Irish | 99.9 /100 | #72 | Exceptional 7.4% |
| Portuguese | 99.9 /100 | #73 | Exceptional 7.4% |
| Icelanders | 99.9 /100 | #74 | Exceptional 7.4% |
| Immigrants | Cambodia | 99.9 /100 | #75 | Exceptional 7.4% |
| Laotians | 99.9 /100 | #76 | Exceptional 7.4% |
| Apache | 99.9 /100 | #77 | Exceptional 7.4% |
| Whites/Caucasians | 99.8 /100 | #78 | Exceptional 7.4% |
| Czechs | 99.8 /100 | #79 | Exceptional 7.4% |
| Alaska Natives | 99.8 /100 | #80 | Exceptional 7.3% |
| Finns | 99.8 /100 | #81 | Exceptional 7.3% |
| Northern Europeans | 99.8 /100 | #82 | Exceptional 7.3% |
| Potawatomi | 99.7 /100 | #83 | Exceptional 7.3% |
| Afghans | 99.7 /100 | #84 | Exceptional 7.3% |
| Cree | 99.7 /100 | #85 | Exceptional 7.2% |
| Immigrants | Indonesia | 99.6 /100 | #86 | Exceptional 7.2% |
| Delaware | 99.6 /100 | #87 | Exceptional 7.2% |
| Immigrants | Nonimmigrants | 99.6 /100 | #88 | Exceptional 7.2% |
| British | 99.6 /100 | #89 | Exceptional 7.2% |
| Creek | 99.6 /100 | #90 | Exceptional 7.2% |
| Assyrians/Chaldeans/Syriacs | 99.4 /100 | #91 | Exceptional 7.2% |