Mongolian vs Assyrian/Chaldean/Syriac Disability
COMPARE
Mongolian
Assyrian/Chaldean/Syriac
Disability
Disability Comparison
Mongolians
Assyrians/Chaldeans/Syriacs
10.8%
DISABILITY
99.9/ 100
METRIC RATING
40th/ 347
METRIC RANK
11.9%
DISABILITY
12.6/ 100
METRIC RATING
201st/ 347
METRIC RANK
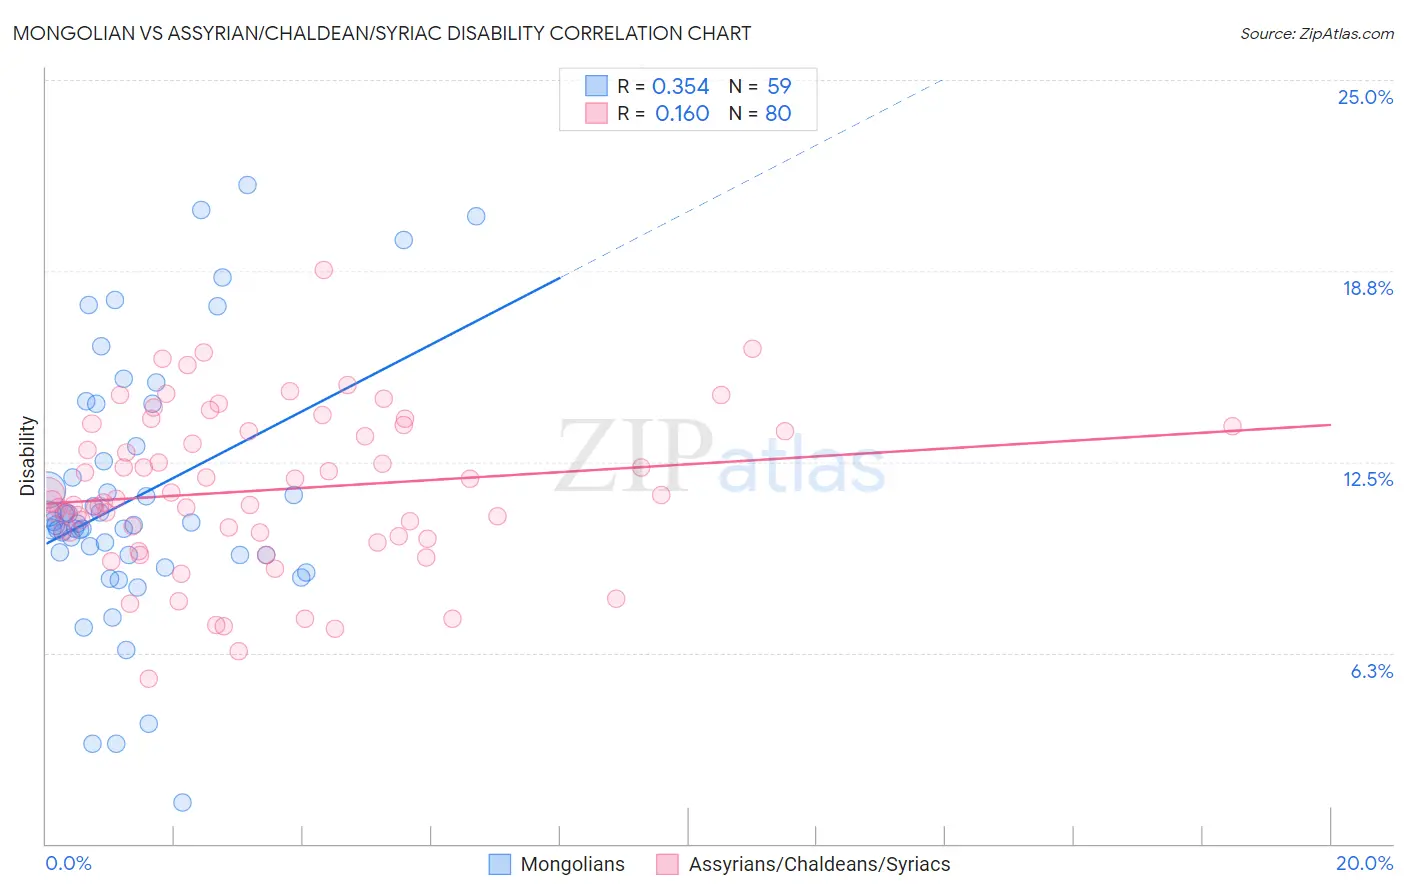
Mongolian vs Assyrian/Chaldean/Syriac Disability Correlation Chart
The statistical analysis conducted on geographies consisting of 140,360,971 people shows a mild positive correlation between the proportion of Mongolians and percentage of population with a disability in the United States with a correlation coefficient (R) of 0.354 and weighted average of 10.8%. Similarly, the statistical analysis conducted on geographies consisting of 110,312,508 people shows a poor positive correlation between the proportion of Assyrians/Chaldeans/Syriacs and percentage of population with a disability in the United States with a correlation coefficient (R) of 0.160 and weighted average of 11.9%, a difference of 11.0%.
Disability Correlation Summary
| Measurement | Mongolian | Assyrian/Chaldean/Syriac |
| Minimum | 1.4% | 5.4% |
| Maximum | 21.6% | 18.8% |
| Range | 20.2% | 13.4% |
| Mean | 11.3% | 11.6% |
| Median | 10.5% | 11.2% |
| Interquartile 25% (IQ1) | 9.5% | 10.1% |
| Interquartile 75% (IQ3) | 13.0% | 13.6% |
| Interquartile Range (IQR) | 3.5% | 3.5% |
| Standard Deviation (Sample) | 4.2% | 2.6% |
| Standard Deviation (Population) | 4.2% | 2.6% |
Similar Demographics by Disability
Demographics Similar to Mongolians by Disability
In terms of disability, the demographic groups most similar to Mongolians are Cambodian (10.8%, a difference of 0.0%), Immigrants from Australia (10.8%, a difference of 0.040%), Afghan (10.8%, a difference of 0.10%), Immigrants from Nepal (10.8%, a difference of 0.14%), and Israeli (10.8%, a difference of 0.19%).
| Demographics | Rating | Rank | Disability |
| Immigrants | Kuwait | 100.0 /100 | #33 | Exceptional 10.7% |
| Immigrants | Ethiopia | 100.0 /100 | #34 | Exceptional 10.7% |
| Immigrants | Indonesia | 100.0 /100 | #35 | Exceptional 10.7% |
| Ethiopians | 100.0 /100 | #36 | Exceptional 10.7% |
| Turks | 100.0 /100 | #37 | Exceptional 10.7% |
| Afghans | 99.9 /100 | #38 | Exceptional 10.8% |
| Cambodians | 99.9 /100 | #39 | Exceptional 10.8% |
| Mongolians | 99.9 /100 | #40 | Exceptional 10.8% |
| Immigrants | Australia | 99.9 /100 | #41 | Exceptional 10.8% |
| Immigrants | Nepal | 99.9 /100 | #42 | Exceptional 10.8% |
| Israelis | 99.9 /100 | #43 | Exceptional 10.8% |
| Immigrants | Japan | 99.9 /100 | #44 | Exceptional 10.8% |
| Immigrants | Peru | 99.9 /100 | #45 | Exceptional 10.8% |
| Tongans | 99.9 /100 | #46 | Exceptional 10.8% |
| Taiwanese | 99.9 /100 | #47 | Exceptional 10.8% |
Demographics Similar to Assyrians/Chaldeans/Syriacs by Disability
In terms of disability, the demographic groups most similar to Assyrians/Chaldeans/Syriacs are Belizean (11.9%, a difference of 0.020%), Immigrants from England (12.0%, a difference of 0.070%), British West Indian (12.0%, a difference of 0.12%), Mexican American Indian (12.0%, a difference of 0.12%), and Immigrants from Panama (11.9%, a difference of 0.18%).
| Demographics | Rating | Rank | Disability |
| Somalis | 17.3 /100 | #194 | Poor 11.9% |
| Barbadians | 15.8 /100 | #195 | Poor 11.9% |
| Serbians | 15.4 /100 | #196 | Poor 11.9% |
| Immigrants | Belize | 15.2 /100 | #197 | Poor 11.9% |
| Ukrainians | 14.7 /100 | #198 | Poor 11.9% |
| Immigrants | Panama | 14.6 /100 | #199 | Poor 11.9% |
| Belizeans | 12.8 /100 | #200 | Poor 11.9% |
| Assyrians/Chaldeans/Syriacs | 12.6 /100 | #201 | Poor 11.9% |
| Immigrants | England | 12.0 /100 | #202 | Poor 12.0% |
| British West Indians | 11.5 /100 | #203 | Poor 12.0% |
| Mexican American Indians | 11.4 /100 | #204 | Poor 12.0% |
| Immigrants | Western Europe | 10.1 /100 | #205 | Poor 12.0% |
| Immigrants | Senegal | 9.4 /100 | #206 | Tragic 12.0% |
| Immigrants | Thailand | 9.3 /100 | #207 | Tragic 12.0% |
| Immigrants | Caribbean | 9.1 /100 | #208 | Tragic 12.0% |