Marshallese vs Subsaharan African 2 or more Vehicles in Household
COMPARE
Marshallese
Subsaharan African
2 or more Vehicles in Household
2 or more Vehicles in Household Comparison
Marshallese
Sub-Saharan Africans
54.9%
2 OR MORE VEHICLES IN HOUSEHOLD
30.5/ 100
METRIC RATING
188th/ 347
METRIC RANK
51.9%
2 OR MORE VEHICLES IN HOUSEHOLD
0.2/ 100
METRIC RATING
272nd/ 347
METRIC RANK
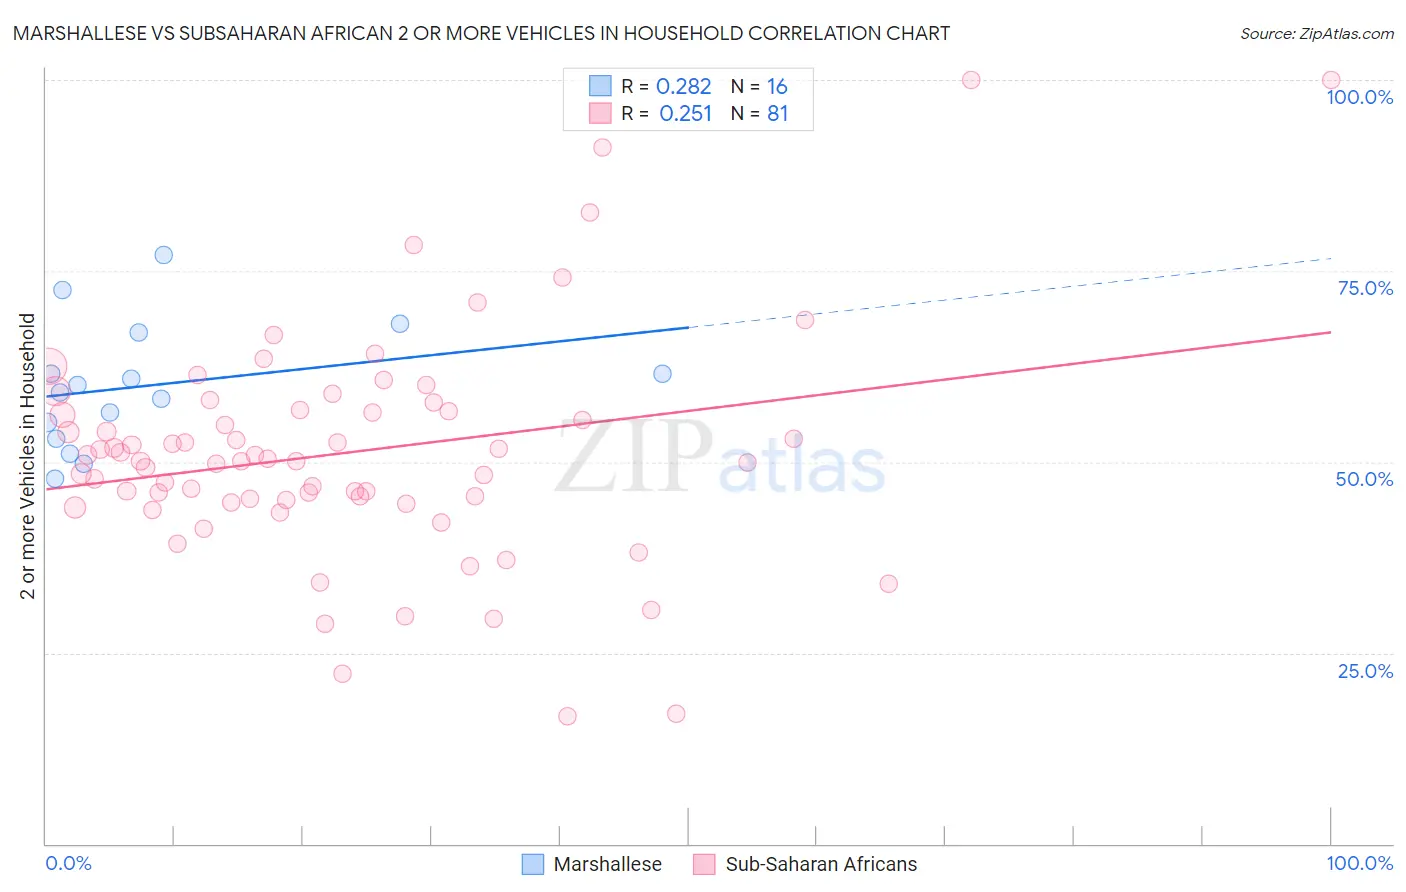
Marshallese vs Subsaharan African 2 or more Vehicles in Household Correlation Chart
The statistical analysis conducted on geographies consisting of 14,761,315 people shows a weak positive correlation between the proportion of Marshallese and percentage of households with 2 or more vehicles available in the United States with a correlation coefficient (R) of 0.282 and weighted average of 54.9%. Similarly, the statistical analysis conducted on geographies consisting of 507,665,982 people shows a weak positive correlation between the proportion of Sub-Saharan Africans and percentage of households with 2 or more vehicles available in the United States with a correlation coefficient (R) of 0.251 and weighted average of 51.9%, a difference of 5.8%.
2 or more Vehicles in Household Correlation Summary
| Measurement | Marshallese | Subsaharan African |
| Minimum | 47.8% | 16.7% |
| Maximum | 77.0% | 100.0% |
| Range | 29.3% | 83.3% |
| Mean | 60.0% | 51.2% |
| Median | 59.6% | 50.1% |
| Interquartile 25% (IQ1) | 54.1% | 44.8% |
| Interquartile 75% (IQ3) | 64.3% | 56.7% |
| Interquartile Range (IQR) | 10.2% | 11.9% |
| Standard Deviation (Sample) | 8.1% | 14.9% |
| Standard Deviation (Population) | 7.9% | 14.8% |
Similar Demographics by 2 or more Vehicles in Household
Demographics Similar to Marshallese by 2 or more Vehicles in Household
In terms of 2 or more vehicles in household, the demographic groups most similar to Marshallese are Immigrants from Uganda (55.0%, a difference of 0.13%), Peruvian (55.0%, a difference of 0.15%), Eastern European (54.8%, a difference of 0.15%), Russian (54.8%, a difference of 0.21%), and Arab (55.0%, a difference of 0.24%).
| Demographics | Rating | Rank | 2 or more Vehicles in Household |
| Immigrants | Micronesia | 38.2 /100 | #181 | Fair 55.1% |
| Cree | 38.2 /100 | #182 | Fair 55.1% |
| Immigrants | Cameroon | 37.3 /100 | #183 | Fair 55.1% |
| Apache | 36.7 /100 | #184 | Fair 55.1% |
| Arabs | 35.9 /100 | #185 | Fair 55.0% |
| Peruvians | 33.7 /100 | #186 | Fair 55.0% |
| Immigrants | Uganda | 33.4 /100 | #187 | Fair 55.0% |
| Marshallese | 30.5 /100 | #188 | Fair 54.9% |
| Eastern Europeans | 27.5 /100 | #189 | Fair 54.8% |
| Russians | 26.3 /100 | #190 | Fair 54.8% |
| Immigrants | Immigrants | 25.0 /100 | #191 | Fair 54.7% |
| Immigrants | Romania | 23.8 /100 | #192 | Fair 54.7% |
| Immigrants | Japan | 23.4 /100 | #193 | Fair 54.7% |
| Central Americans | 23.0 /100 | #194 | Fair 54.7% |
| Iroquois | 22.6 /100 | #195 | Fair 54.7% |
Demographics Similar to Sub-Saharan Africans by 2 or more Vehicles in Household
In terms of 2 or more vehicles in household, the demographic groups most similar to Sub-Saharan Africans are South American (51.9%, a difference of 0.020%), Israeli (51.9%, a difference of 0.090%), African (51.8%, a difference of 0.14%), Immigrants from Honduras (51.8%, a difference of 0.15%), and Immigrants from Croatia (51.8%, a difference of 0.18%).
| Demographics | Rating | Rank | 2 or more Vehicles in Household |
| Immigrants | Congo | 0.3 /100 | #265 | Tragic 52.1% |
| Immigrants | France | 0.2 /100 | #266 | Tragic 52.0% |
| Immigrants | Colombia | 0.2 /100 | #267 | Tragic 52.0% |
| Pima | 0.2 /100 | #268 | Tragic 52.0% |
| Hondurans | 0.2 /100 | #269 | Tragic 52.0% |
| Immigrants | Ireland | 0.2 /100 | #270 | Tragic 52.0% |
| South Americans | 0.2 /100 | #271 | Tragic 51.9% |
| Sub-Saharan Africans | 0.2 /100 | #272 | Tragic 51.9% |
| Israelis | 0.2 /100 | #273 | Tragic 51.9% |
| Africans | 0.2 /100 | #274 | Tragic 51.8% |
| Immigrants | Honduras | 0.2 /100 | #275 | Tragic 51.8% |
| Immigrants | Croatia | 0.2 /100 | #276 | Tragic 51.8% |
| Immigrants | Africa | 0.2 /100 | #277 | Tragic 51.8% |
| Yuman | 0.1 /100 | #278 | Tragic 51.7% |
| Liberians | 0.1 /100 | #279 | Tragic 51.7% |