Marshallese vs Subsaharan African In Labor Force | Age 35-44
COMPARE
Marshallese
Subsaharan African
In Labor Force | Age 35-44
In Labor Force | Age 35-44 Comparison
Marshallese
Sub-Saharan Africans
82.4%
IN LABOR FORCE | AGE 35-44
0.0/ 100
METRIC RATING
304th/ 347
METRIC RANK
84.1%
IN LABOR FORCE | AGE 35-44
9.3/ 100
METRIC RATING
219th/ 347
METRIC RANK
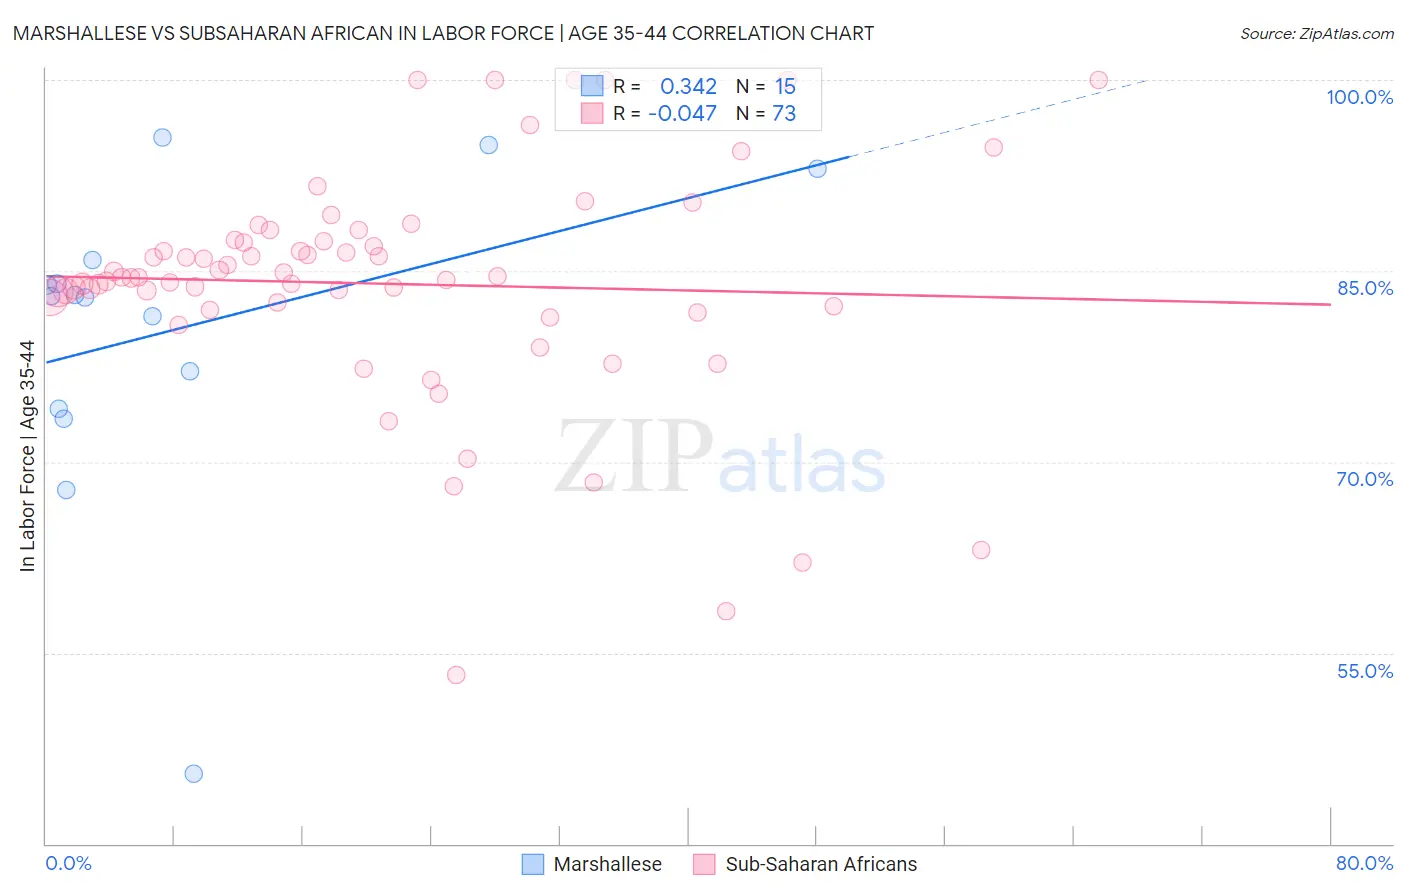
Marshallese vs Subsaharan African In Labor Force | Age 35-44 Correlation Chart
The statistical analysis conducted on geographies consisting of 14,760,991 people shows a mild positive correlation between the proportion of Marshallese and labor force participation rate among population between the ages 35 and 44 in the United States with a correlation coefficient (R) of 0.342 and weighted average of 82.4%. Similarly, the statistical analysis conducted on geographies consisting of 507,706,438 people shows no correlation between the proportion of Sub-Saharan Africans and labor force participation rate among population between the ages 35 and 44 in the United States with a correlation coefficient (R) of -0.047 and weighted average of 84.1%, a difference of 2.0%.
In Labor Force | Age 35-44 Correlation Summary
| Measurement | Marshallese | Subsaharan African |
| Minimum | 45.5% | 53.3% |
| Maximum | 95.5% | 100.0% |
| Range | 50.0% | 46.7% |
| Mean | 80.4% | 84.0% |
| Median | 83.0% | 84.5% |
| Interquartile 25% (IQ1) | 74.1% | 82.1% |
| Interquartile 75% (IQ3) | 85.9% | 87.4% |
| Interquartile Range (IQR) | 11.8% | 5.3% |
| Standard Deviation (Sample) | 12.4% | 9.1% |
| Standard Deviation (Population) | 12.0% | 9.0% |
Similar Demographics by In Labor Force | Age 35-44
Demographics Similar to Marshallese by In Labor Force | Age 35-44
In terms of in labor force | age 35-44, the demographic groups most similar to Marshallese are American (82.4%, a difference of 0.010%), Nepalese (82.4%, a difference of 0.010%), Spanish American Indian (82.5%, a difference of 0.080%), Central American Indian (82.5%, a difference of 0.11%), and Tlingit-Haida (82.5%, a difference of 0.17%).
| Demographics | Rating | Rank | In Labor Force | Age 35-44 |
| Hmong | 0.0 /100 | #297 | Tragic 82.6% |
| Ottawa | 0.0 /100 | #298 | Tragic 82.6% |
| Tlingit-Haida | 0.0 /100 | #299 | Tragic 82.5% |
| Central American Indians | 0.0 /100 | #300 | Tragic 82.5% |
| Spanish American Indians | 0.0 /100 | #301 | Tragic 82.5% |
| Americans | 0.0 /100 | #302 | Tragic 82.4% |
| Nepalese | 0.0 /100 | #303 | Tragic 82.4% |
| Marshallese | 0.0 /100 | #304 | Tragic 82.4% |
| Shoshone | 0.0 /100 | #305 | Tragic 82.2% |
| Blacks/African Americans | 0.0 /100 | #306 | Tragic 82.2% |
| Hispanics or Latinos | 0.0 /100 | #307 | Tragic 82.1% |
| Immigrants | Central America | 0.0 /100 | #308 | Tragic 82.0% |
| Cree | 0.0 /100 | #309 | Tragic 82.0% |
| Blackfeet | 0.0 /100 | #310 | Tragic 81.9% |
| Colville | 0.0 /100 | #311 | Tragic 81.7% |
Demographics Similar to Sub-Saharan Africans by In Labor Force | Age 35-44
In terms of in labor force | age 35-44, the demographic groups most similar to Sub-Saharan Africans are Immigrants from Nicaragua (84.1%, a difference of 0.0%), Immigrants from Norway (84.1%, a difference of 0.040%), French (84.0%, a difference of 0.040%), European (84.1%, a difference of 0.050%), and Nicaraguan (84.1%, a difference of 0.050%).
| Demographics | Rating | Rank | In Labor Force | Age 35-44 |
| Israelis | 14.0 /100 | #212 | Poor 84.1% |
| Bangladeshis | 13.7 /100 | #213 | Poor 84.1% |
| Immigrants | Barbados | 13.2 /100 | #214 | Poor 84.1% |
| Europeans | 12.2 /100 | #215 | Poor 84.1% |
| Nicaraguans | 12.1 /100 | #216 | Poor 84.1% |
| Immigrants | Norway | 11.7 /100 | #217 | Poor 84.1% |
| Immigrants | Nicaragua | 9.4 /100 | #218 | Tragic 84.1% |
| Sub-Saharan Africans | 9.3 /100 | #219 | Tragic 84.1% |
| French | 7.5 /100 | #220 | Tragic 84.0% |
| Icelanders | 6.7 /100 | #221 | Tragic 84.0% |
| Assyrians/Chaldeans/Syriacs | 6.6 /100 | #222 | Tragic 84.0% |
| Immigrants | Panama | 6.4 /100 | #223 | Tragic 84.0% |
| U.S. Virgin Islanders | 6.1 /100 | #224 | Tragic 84.0% |
| Immigrants | Burma/Myanmar | 6.1 /100 | #225 | Tragic 84.0% |
| Panamanians | 5.4 /100 | #226 | Tragic 84.0% |