Marshallese vs Pueblo 2 or more Vehicles in Household
COMPARE
Marshallese
Pueblo
2 or more Vehicles in Household
2 or more Vehicles in Household Comparison
Marshallese
Pueblo
54.9%
2 OR MORE VEHICLES IN HOUSEHOLD
30.5/ 100
METRIC RATING
188th/ 347
METRIC RANK
57.5%
2 OR MORE VEHICLES IN HOUSEHOLD
98.0/ 100
METRIC RATING
112th/ 347
METRIC RANK
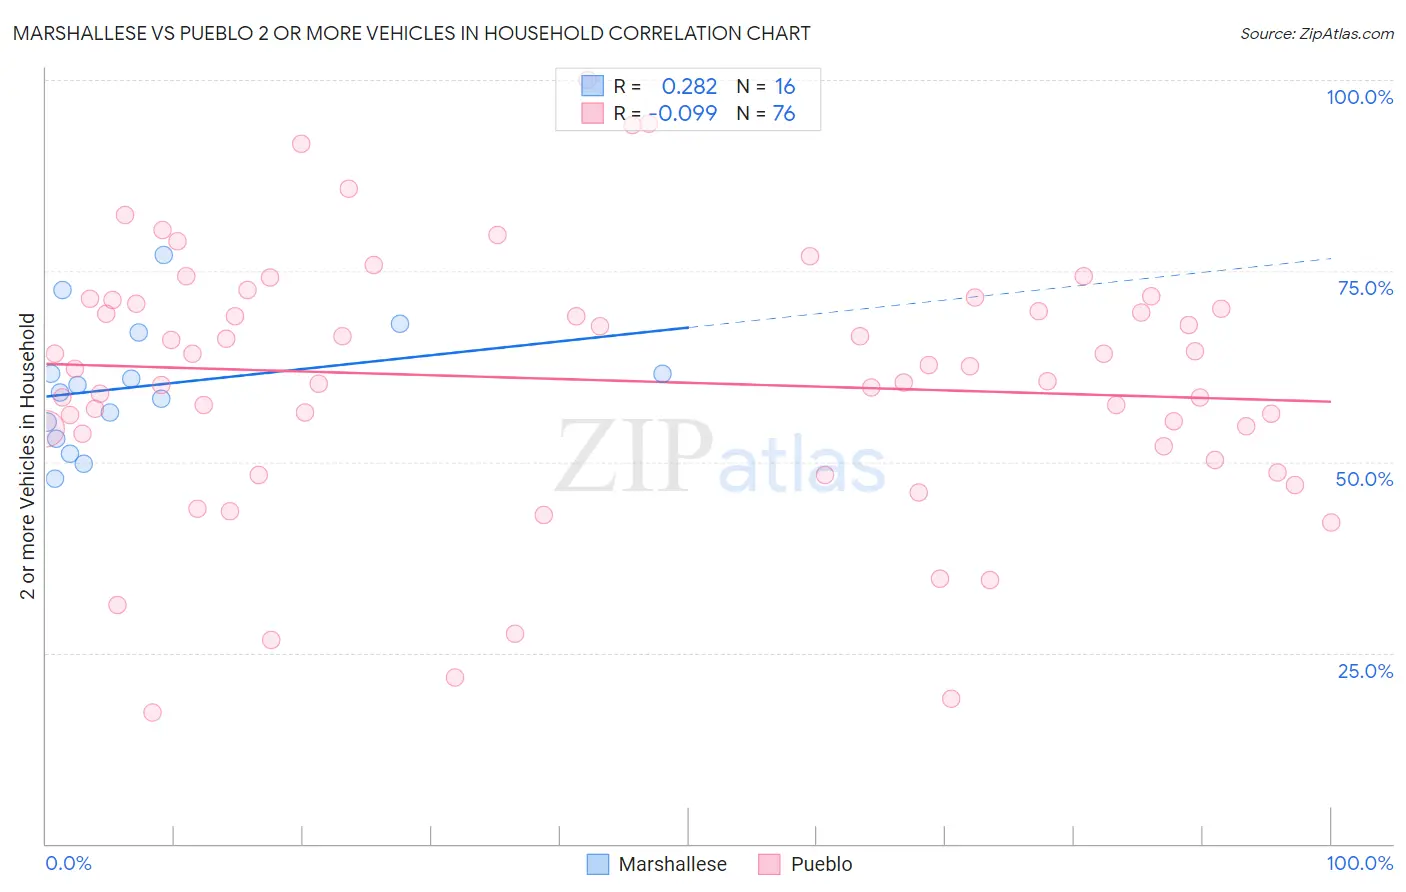
Marshallese vs Pueblo 2 or more Vehicles in Household Correlation Chart
The statistical analysis conducted on geographies consisting of 14,761,315 people shows a weak positive correlation between the proportion of Marshallese and percentage of households with 2 or more vehicles available in the United States with a correlation coefficient (R) of 0.282 and weighted average of 54.9%. Similarly, the statistical analysis conducted on geographies consisting of 120,072,908 people shows a slight negative correlation between the proportion of Pueblo and percentage of households with 2 or more vehicles available in the United States with a correlation coefficient (R) of -0.099 and weighted average of 57.5%, a difference of 4.7%.
2 or more Vehicles in Household Correlation Summary
| Measurement | Marshallese | Pueblo |
| Minimum | 47.8% | 17.1% |
| Maximum | 77.0% | 100.0% |
| Range | 29.3% | 82.9% |
| Mean | 60.0% | 60.7% |
| Median | 59.6% | 62.3% |
| Interquartile 25% (IQ1) | 54.1% | 52.9% |
| Interquartile 75% (IQ3) | 64.3% | 70.9% |
| Interquartile Range (IQR) | 10.2% | 18.0% |
| Standard Deviation (Sample) | 8.1% | 17.0% |
| Standard Deviation (Population) | 7.9% | 16.9% |
Similar Demographics by 2 or more Vehicles in Household
Demographics Similar to Marshallese by 2 or more Vehicles in Household
In terms of 2 or more vehicles in household, the demographic groups most similar to Marshallese are Immigrants from Uganda (55.0%, a difference of 0.13%), Peruvian (55.0%, a difference of 0.15%), Eastern European (54.8%, a difference of 0.15%), Russian (54.8%, a difference of 0.21%), and Arab (55.0%, a difference of 0.24%).
| Demographics | Rating | Rank | 2 or more Vehicles in Household |
| Immigrants | Micronesia | 38.2 /100 | #181 | Fair 55.1% |
| Cree | 38.2 /100 | #182 | Fair 55.1% |
| Immigrants | Cameroon | 37.3 /100 | #183 | Fair 55.1% |
| Apache | 36.7 /100 | #184 | Fair 55.1% |
| Arabs | 35.9 /100 | #185 | Fair 55.0% |
| Peruvians | 33.7 /100 | #186 | Fair 55.0% |
| Immigrants | Uganda | 33.4 /100 | #187 | Fair 55.0% |
| Marshallese | 30.5 /100 | #188 | Fair 54.9% |
| Eastern Europeans | 27.5 /100 | #189 | Fair 54.8% |
| Russians | 26.3 /100 | #190 | Fair 54.8% |
| Immigrants | Immigrants | 25.0 /100 | #191 | Fair 54.7% |
| Immigrants | Romania | 23.8 /100 | #192 | Fair 54.7% |
| Immigrants | Japan | 23.4 /100 | #193 | Fair 54.7% |
| Central Americans | 23.0 /100 | #194 | Fair 54.7% |
| Iroquois | 22.6 /100 | #195 | Fair 54.7% |
Demographics Similar to Pueblo by 2 or more Vehicles in Household
In terms of 2 or more vehicles in household, the demographic groups most similar to Pueblo are Greek (57.5%, a difference of 0.0%), Japanese (57.5%, a difference of 0.040%), Immigrants from North America (57.5%, a difference of 0.050%), Immigrants from Canada (57.5%, a difference of 0.090%), and Immigrants from Netherlands (57.5%, a difference of 0.10%).
| Demographics | Rating | Rank | 2 or more Vehicles in Household |
| Immigrants | Korea | 98.2 /100 | #105 | Exceptional 57.6% |
| Immigrants | Oceania | 98.2 /100 | #106 | Exceptional 57.5% |
| Immigrants | Netherlands | 98.2 /100 | #107 | Exceptional 57.5% |
| Immigrants | Canada | 98.1 /100 | #108 | Exceptional 57.5% |
| Immigrants | North America | 98.1 /100 | #109 | Exceptional 57.5% |
| Japanese | 98.0 /100 | #110 | Exceptional 57.5% |
| Greeks | 98.0 /100 | #111 | Exceptional 57.5% |
| Pueblo | 98.0 /100 | #112 | Exceptional 57.5% |
| Zimbabweans | 96.9 /100 | #113 | Exceptional 57.2% |
| Immigrants | Lebanon | 96.8 /100 | #114 | Exceptional 57.2% |
| Chippewa | 96.6 /100 | #115 | Exceptional 57.2% |
| Immigrants | Jordan | 96.6 /100 | #116 | Exceptional 57.2% |
| Iraqis | 95.8 /100 | #117 | Exceptional 57.1% |
| Asians | 95.1 /100 | #118 | Exceptional 57.0% |
| Natives/Alaskans | 95.0 /100 | #119 | Exceptional 57.0% |