Immigrants from Serbia vs Subsaharan African 2 or more Vehicles in Household
COMPARE
Immigrants from Serbia
Subsaharan African
2 or more Vehicles in Household
2 or more Vehicles in Household Comparison
Immigrants from Serbia
Sub-Saharan Africans
51.3%
2 OR MORE VEHICLES IN HOUSEHOLD
0.1/ 100
METRIC RATING
287th/ 347
METRIC RANK
51.9%
2 OR MORE VEHICLES IN HOUSEHOLD
0.2/ 100
METRIC RATING
272nd/ 347
METRIC RANK
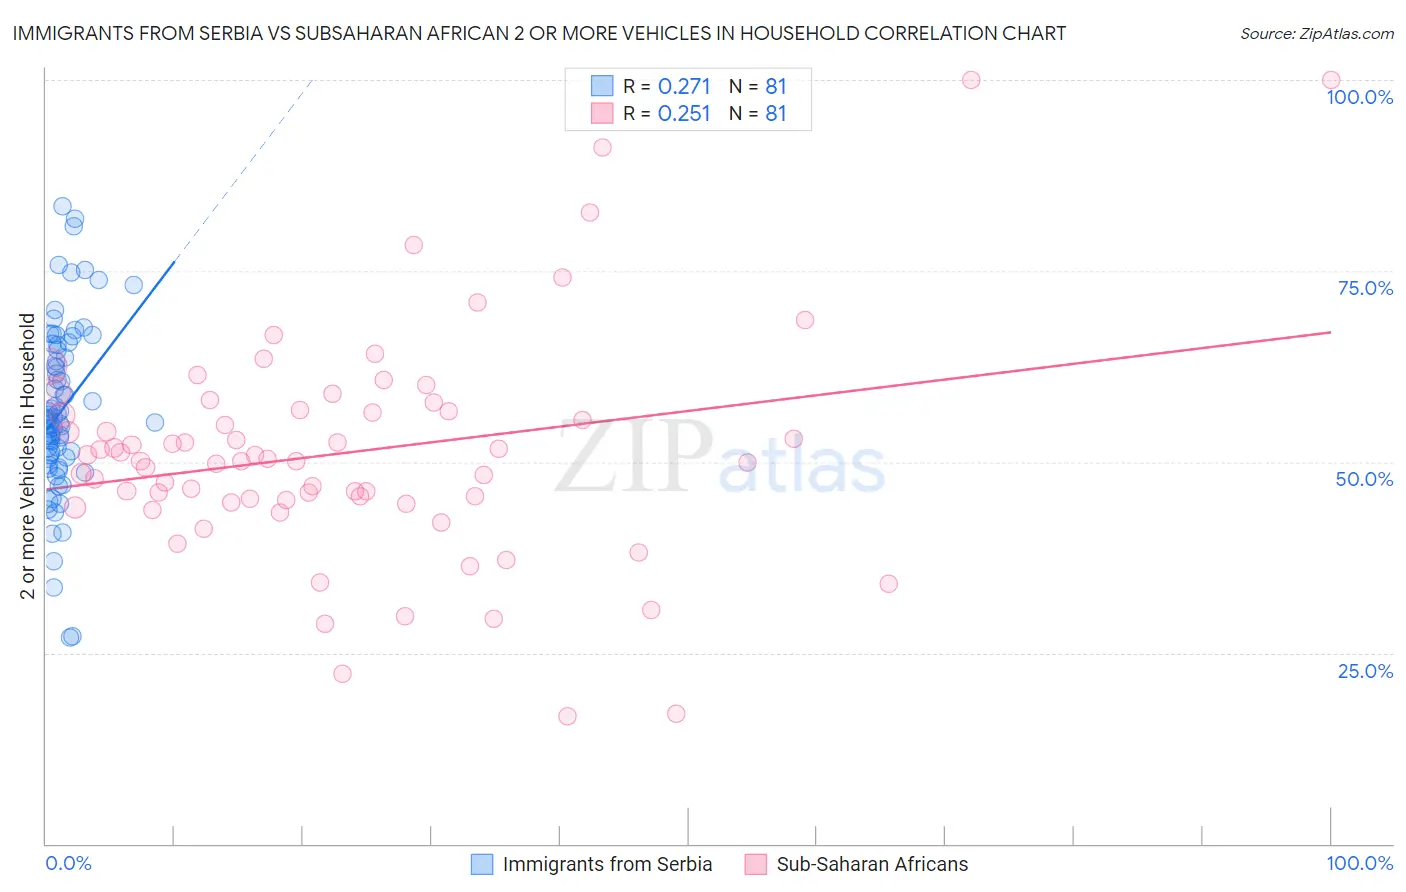
Immigrants from Serbia vs Subsaharan African 2 or more Vehicles in Household Correlation Chart
The statistical analysis conducted on geographies consisting of 131,726,431 people shows a weak positive correlation between the proportion of Immigrants from Serbia and percentage of households with 2 or more vehicles available in the United States with a correlation coefficient (R) of 0.271 and weighted average of 51.3%. Similarly, the statistical analysis conducted on geographies consisting of 507,665,982 people shows a weak positive correlation between the proportion of Sub-Saharan Africans and percentage of households with 2 or more vehicles available in the United States with a correlation coefficient (R) of 0.251 and weighted average of 51.9%, a difference of 1.2%.
2 or more Vehicles in Household Correlation Summary
| Measurement | Immigrants from Serbia | Subsaharan African |
| Minimum | 27.0% | 16.7% |
| Maximum | 83.4% | 100.0% |
| Range | 56.4% | 83.3% |
| Mean | 56.7% | 51.2% |
| Median | 55.6% | 50.1% |
| Interquartile 25% (IQ1) | 50.5% | 44.8% |
| Interquartile 75% (IQ3) | 65.0% | 56.7% |
| Interquartile Range (IQR) | 14.5% | 11.9% |
| Standard Deviation (Sample) | 11.1% | 14.9% |
| Standard Deviation (Population) | 11.1% | 14.8% |
Demographics Similar to Immigrants from Serbia and Sub-Saharan Africans by 2 or more Vehicles in Household
In terms of 2 or more vehicles in household, the demographic groups most similar to Immigrants from Serbia are Immigrants from Liberia (51.3%, a difference of 0.020%), Okinawan (51.2%, a difference of 0.12%), Immigrants from Uruguay (51.4%, a difference of 0.17%), Immigrants from Zaire (51.5%, a difference of 0.33%), and Immigrants from China (51.5%, a difference of 0.37%). Similarly, the demographic groups most similar to Sub-Saharan Africans are South American (51.9%, a difference of 0.020%), Israeli (51.9%, a difference of 0.090%), African (51.8%, a difference of 0.14%), Immigrants from Honduras (51.8%, a difference of 0.15%), and Immigrants from Croatia (51.8%, a difference of 0.18%).
| Demographics | Rating | Rank | 2 or more Vehicles in Household |
| Hondurans | 0.2 /100 | #269 | Tragic 52.0% |
| Immigrants | Ireland | 0.2 /100 | #270 | Tragic 52.0% |
| South Americans | 0.2 /100 | #271 | Tragic 51.9% |
| Sub-Saharan Africans | 0.2 /100 | #272 | Tragic 51.9% |
| Israelis | 0.2 /100 | #273 | Tragic 51.9% |
| Africans | 0.2 /100 | #274 | Tragic 51.8% |
| Immigrants | Honduras | 0.2 /100 | #275 | Tragic 51.8% |
| Immigrants | Croatia | 0.2 /100 | #276 | Tragic 51.8% |
| Immigrants | Africa | 0.2 /100 | #277 | Tragic 51.8% |
| Yuman | 0.1 /100 | #278 | Tragic 51.7% |
| Liberians | 0.1 /100 | #279 | Tragic 51.7% |
| Immigrants | Eastern Europe | 0.1 /100 | #280 | Tragic 51.7% |
| Immigrants | Kazakhstan | 0.1 /100 | #281 | Tragic 51.6% |
| Bahamians | 0.1 /100 | #282 | Tragic 51.5% |
| Immigrants | China | 0.1 /100 | #283 | Tragic 51.5% |
| Immigrants | Zaire | 0.1 /100 | #284 | Tragic 51.5% |
| Immigrants | Uruguay | 0.1 /100 | #285 | Tragic 51.4% |
| Immigrants | Liberia | 0.1 /100 | #286 | Tragic 51.3% |
| Immigrants | Serbia | 0.1 /100 | #287 | Tragic 51.3% |
| Okinawans | 0.1 /100 | #288 | Tragic 51.2% |
| Somalis | 0.0 /100 | #289 | Tragic 51.1% |