Immigrants from Western Asia vs Subsaharan African 2 or more Vehicles in Household
COMPARE
Immigrants from Western Asia
Subsaharan African
2 or more Vehicles in Household
2 or more Vehicles in Household Comparison
Immigrants from Western Asia
Sub-Saharan Africans
54.1%
2 OR MORE VEHICLES IN HOUSEHOLD
9.3/ 100
METRIC RATING
216th/ 347
METRIC RANK
51.9%
2 OR MORE VEHICLES IN HOUSEHOLD
0.2/ 100
METRIC RATING
272nd/ 347
METRIC RANK
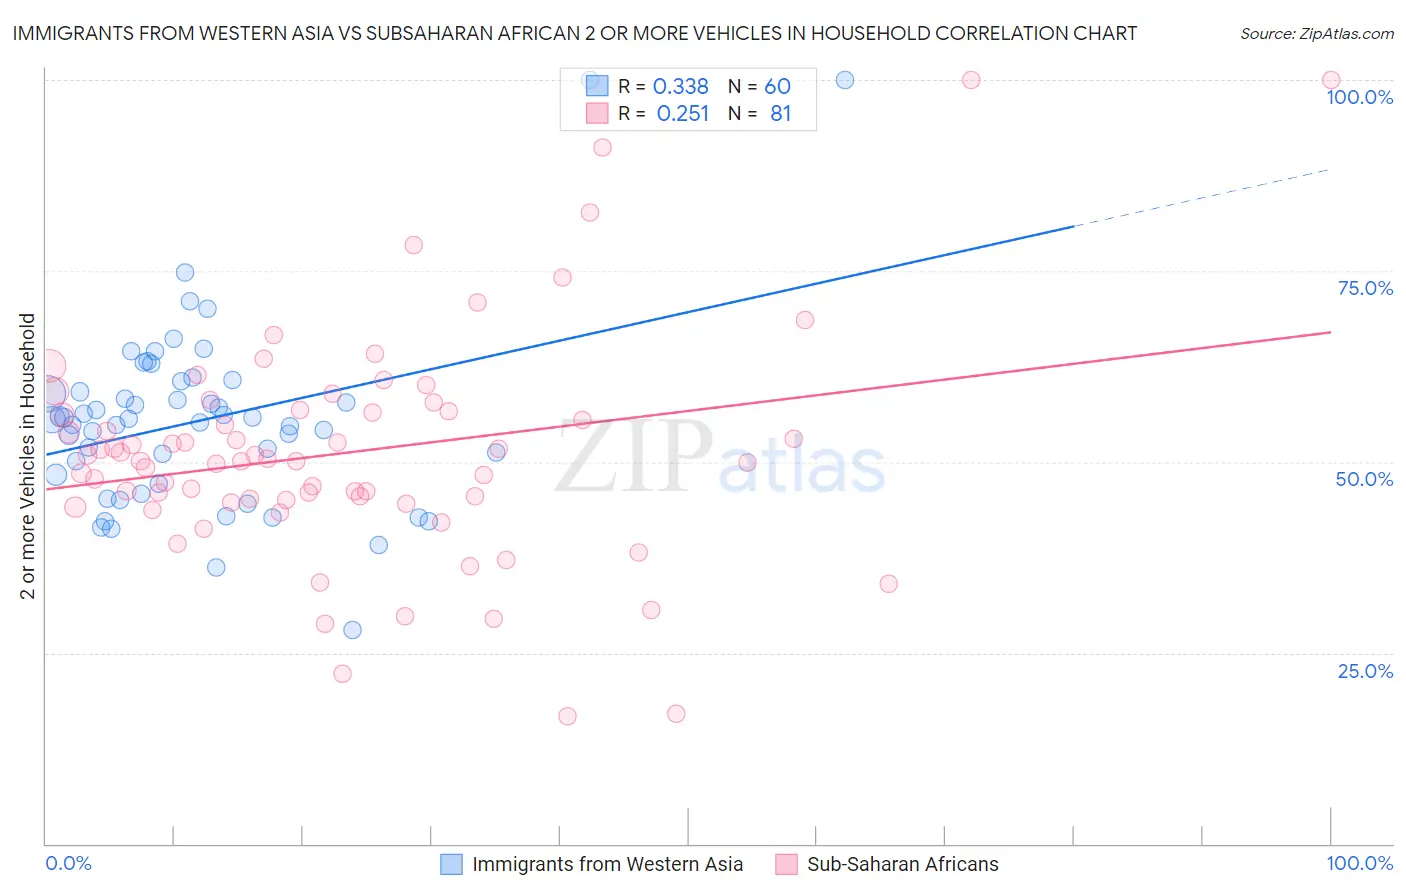
Immigrants from Western Asia vs Subsaharan African 2 or more Vehicles in Household Correlation Chart
The statistical analysis conducted on geographies consisting of 404,211,339 people shows a mild positive correlation between the proportion of Immigrants from Western Asia and percentage of households with 2 or more vehicles available in the United States with a correlation coefficient (R) of 0.338 and weighted average of 54.1%. Similarly, the statistical analysis conducted on geographies consisting of 507,665,982 people shows a weak positive correlation between the proportion of Sub-Saharan Africans and percentage of households with 2 or more vehicles available in the United States with a correlation coefficient (R) of 0.251 and weighted average of 51.9%, a difference of 4.2%.
2 or more Vehicles in Household Correlation Summary
| Measurement | Immigrants from Western Asia | Subsaharan African |
| Minimum | 28.0% | 16.7% |
| Maximum | 100.0% | 100.0% |
| Range | 72.0% | 83.3% |
| Mean | 55.4% | 51.2% |
| Median | 55.6% | 50.1% |
| Interquartile 25% (IQ1) | 47.7% | 44.8% |
| Interquartile 75% (IQ3) | 59.9% | 56.7% |
| Interquartile Range (IQR) | 12.2% | 11.9% |
| Standard Deviation (Sample) | 12.2% | 14.9% |
| Standard Deviation (Population) | 12.1% | 14.8% |
Similar Demographics by 2 or more Vehicles in Household
Demographics Similar to Immigrants from Western Asia by 2 or more Vehicles in Household
In terms of 2 or more vehicles in household, the demographic groups most similar to Immigrants from Western Asia are Aleut (54.1%, a difference of 0.0%), Immigrants from Czechoslovakia (54.1%, a difference of 0.020%), Guatemalan (54.1%, a difference of 0.040%), Immigrants from Chile (54.2%, a difference of 0.20%), and Immigrants from Hungary (54.2%, a difference of 0.22%).
| Demographics | Rating | Rank | 2 or more Vehicles in Household |
| Immigrants | Bulgaria | 12.0 /100 | #209 | Poor 54.3% |
| Immigrants | Saudi Arabia | 11.3 /100 | #210 | Poor 54.2% |
| Immigrants | Hungary | 11.3 /100 | #211 | Poor 54.2% |
| Immigrants | Chile | 11.1 /100 | #212 | Poor 54.2% |
| Guatemalans | 9.6 /100 | #213 | Tragic 54.1% |
| Immigrants | Czechoslovakia | 9.4 /100 | #214 | Tragic 54.1% |
| Aleuts | 9.3 /100 | #215 | Tragic 54.1% |
| Immigrants | Western Asia | 9.3 /100 | #216 | Tragic 54.1% |
| Immigrants | Burma/Myanmar | 7.1 /100 | #217 | Tragic 53.9% |
| Immigrants | Argentina | 6.8 /100 | #218 | Tragic 53.9% |
| South American Indians | 6.5 /100 | #219 | Tragic 53.9% |
| Taiwanese | 6.3 /100 | #220 | Tragic 53.9% |
| Immigrants | Singapore | 6.3 /100 | #221 | Tragic 53.9% |
| Kiowa | 6.2 /100 | #222 | Tragic 53.9% |
| Immigrants | Bosnia and Herzegovina | 5.5 /100 | #223 | Tragic 53.8% |
Demographics Similar to Sub-Saharan Africans by 2 or more Vehicles in Household
In terms of 2 or more vehicles in household, the demographic groups most similar to Sub-Saharan Africans are South American (51.9%, a difference of 0.020%), Israeli (51.9%, a difference of 0.090%), African (51.8%, a difference of 0.14%), Immigrants from Honduras (51.8%, a difference of 0.15%), and Immigrants from Croatia (51.8%, a difference of 0.18%).
| Demographics | Rating | Rank | 2 or more Vehicles in Household |
| Immigrants | Congo | 0.3 /100 | #265 | Tragic 52.1% |
| Immigrants | France | 0.2 /100 | #266 | Tragic 52.0% |
| Immigrants | Colombia | 0.2 /100 | #267 | Tragic 52.0% |
| Pima | 0.2 /100 | #268 | Tragic 52.0% |
| Hondurans | 0.2 /100 | #269 | Tragic 52.0% |
| Immigrants | Ireland | 0.2 /100 | #270 | Tragic 52.0% |
| South Americans | 0.2 /100 | #271 | Tragic 51.9% |
| Sub-Saharan Africans | 0.2 /100 | #272 | Tragic 51.9% |
| Israelis | 0.2 /100 | #273 | Tragic 51.9% |
| Africans | 0.2 /100 | #274 | Tragic 51.8% |
| Immigrants | Honduras | 0.2 /100 | #275 | Tragic 51.8% |
| Immigrants | Croatia | 0.2 /100 | #276 | Tragic 51.8% |
| Immigrants | Africa | 0.2 /100 | #277 | Tragic 51.8% |
| Yuman | 0.1 /100 | #278 | Tragic 51.7% |
| Liberians | 0.1 /100 | #279 | Tragic 51.7% |