Marshallese vs Immigrants from Western Europe Currently Married
COMPARE
Marshallese
Immigrants from Western Europe
Currently Married
Currently Married Comparison
Marshallese
Immigrants from Western Europe
45.5%
CURRENTLY MARRIED
7.2/ 100
METRIC RATING
212th/ 347
METRIC RANK
47.6%
CURRENTLY MARRIED
91.1/ 100
METRIC RATING
112th/ 347
METRIC RANK
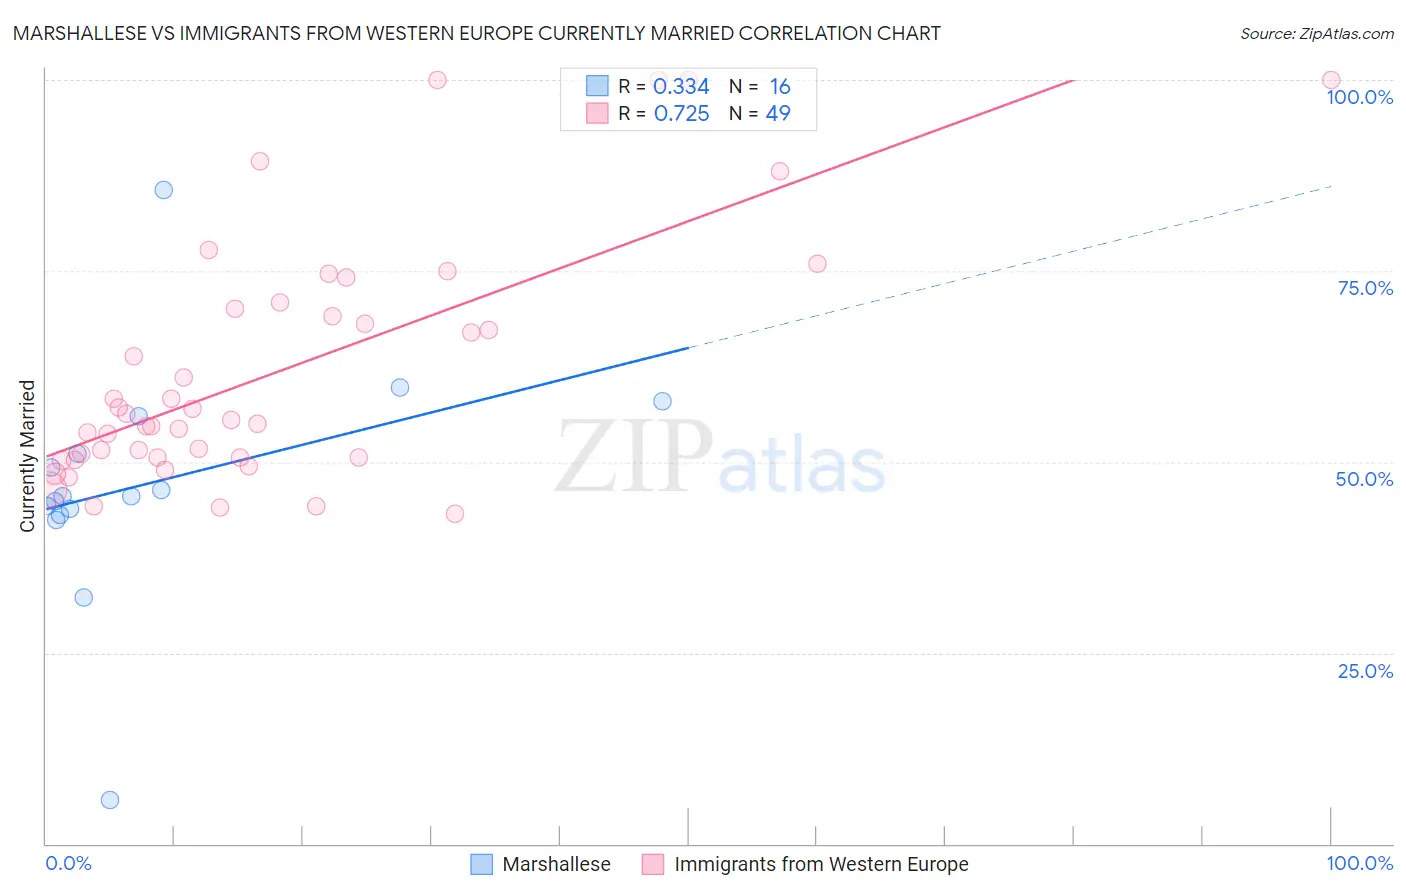
Marshallese vs Immigrants from Western Europe Currently Married Correlation Chart
The statistical analysis conducted on geographies consisting of 14,761,315 people shows a mild positive correlation between the proportion of Marshallese and percentage of population currently married in the United States with a correlation coefficient (R) of 0.334 and weighted average of 45.5%. Similarly, the statistical analysis conducted on geographies consisting of 494,018,358 people shows a strong positive correlation between the proportion of Immigrants from Western Europe and percentage of population currently married in the United States with a correlation coefficient (R) of 0.725 and weighted average of 47.6%, a difference of 4.6%.
Currently Married Correlation Summary
| Measurement | Marshallese | Immigrants from Western Europe |
| Minimum | 5.8% | 43.2% |
| Maximum | 85.6% | 100.0% |
| Range | 79.8% | 56.8% |
| Mean | 47.1% | 61.9% |
| Median | 45.5% | 55.4% |
| Interquartile 25% (IQ1) | 43.5% | 50.5% |
| Interquartile 75% (IQ3) | 53.5% | 70.5% |
| Interquartile Range (IQR) | 10.0% | 19.9% |
| Standard Deviation (Sample) | 16.0% | 16.0% |
| Standard Deviation (Population) | 15.5% | 15.8% |
Similar Demographics by Currently Married
Demographics Similar to Marshallese by Currently Married
In terms of currently married, the demographic groups most similar to Marshallese are Houma (45.5%, a difference of 0.010%), Alaska Native (45.5%, a difference of 0.030%), Dutch West Indian (45.5%, a difference of 0.070%), German Russian (45.5%, a difference of 0.070%), and Uruguayan (45.6%, a difference of 0.090%).
| Demographics | Rating | Rank | Currently Married |
| South American Indians | 11.5 /100 | #205 | Poor 45.8% |
| Immigrants | Immigrants | 11.2 /100 | #206 | Poor 45.8% |
| Immigrants | South America | 10.8 /100 | #207 | Poor 45.7% |
| Alsatians | 10.8 /100 | #208 | Poor 45.7% |
| Immigrants | Micronesia | 8.8 /100 | #209 | Tragic 45.6% |
| Uruguayans | 7.9 /100 | #210 | Tragic 45.6% |
| Houma | 7.2 /100 | #211 | Tragic 45.5% |
| Marshallese | 7.2 /100 | #212 | Tragic 45.5% |
| Alaska Natives | 7.0 /100 | #213 | Tragic 45.5% |
| Dutch West Indians | 6.7 /100 | #214 | Tragic 45.5% |
| German Russians | 6.7 /100 | #215 | Tragic 45.5% |
| Immigrants | Morocco | 5.5 /100 | #216 | Tragic 45.4% |
| Immigrants | Thailand | 5.1 /100 | #217 | Tragic 45.4% |
| Panamanians | 4.0 /100 | #218 | Tragic 45.3% |
| Immigrants | Portugal | 3.5 /100 | #219 | Tragic 45.2% |
Demographics Similar to Immigrants from Western Europe by Currently Married
In terms of currently married, the demographic groups most similar to Immigrants from Western Europe are Immigrants from Hungary (47.6%, a difference of 0.010%), Immigrants from Denmark (47.6%, a difference of 0.030%), South African (47.6%, a difference of 0.060%), Immigrants from Indonesia (47.6%, a difference of 0.070%), and Palestinian (47.6%, a difference of 0.070%).
| Demographics | Rating | Rank | Currently Married |
| Immigrants | Singapore | 93.3 /100 | #105 | Exceptional 47.8% |
| Immigrants | Greece | 93.1 /100 | #106 | Exceptional 47.7% |
| Immigrants | Italy | 92.9 /100 | #107 | Exceptional 47.7% |
| Tsimshian | 92.4 /100 | #108 | Exceptional 47.7% |
| Immigrants | Egypt | 92.3 /100 | #109 | Exceptional 47.7% |
| Immigrants | Russia | 92.0 /100 | #110 | Exceptional 47.7% |
| Immigrants | Hungary | 91.2 /100 | #111 | Exceptional 47.6% |
| Immigrants | Western Europe | 91.1 /100 | #112 | Exceptional 47.6% |
| Immigrants | Denmark | 90.9 /100 | #113 | Exceptional 47.6% |
| South Africans | 90.5 /100 | #114 | Exceptional 47.6% |
| Immigrants | Indonesia | 90.5 /100 | #115 | Exceptional 47.6% |
| Palestinians | 90.4 /100 | #116 | Exceptional 47.6% |
| Puget Sound Salish | 90.3 /100 | #117 | Exceptional 47.6% |
| Immigrants | Philippines | 90.2 /100 | #118 | Exceptional 47.6% |
| Australians | 90.2 /100 | #119 | Exceptional 47.6% |