Lebanese vs Immigrants from Ireland Single Father Households
COMPARE
Lebanese
Immigrants from Ireland
Single Father Households
Single Father Households Comparison
Lebanese
Immigrants from Ireland
2.1%
SINGLE FATHER HOUSEHOLDS
98.9/ 100
METRIC RATING
103rd/ 347
METRIC RANK
1.8%
SINGLE FATHER HOUSEHOLDS
100.0/ 100
METRIC RATING
8th/ 347
METRIC RANK
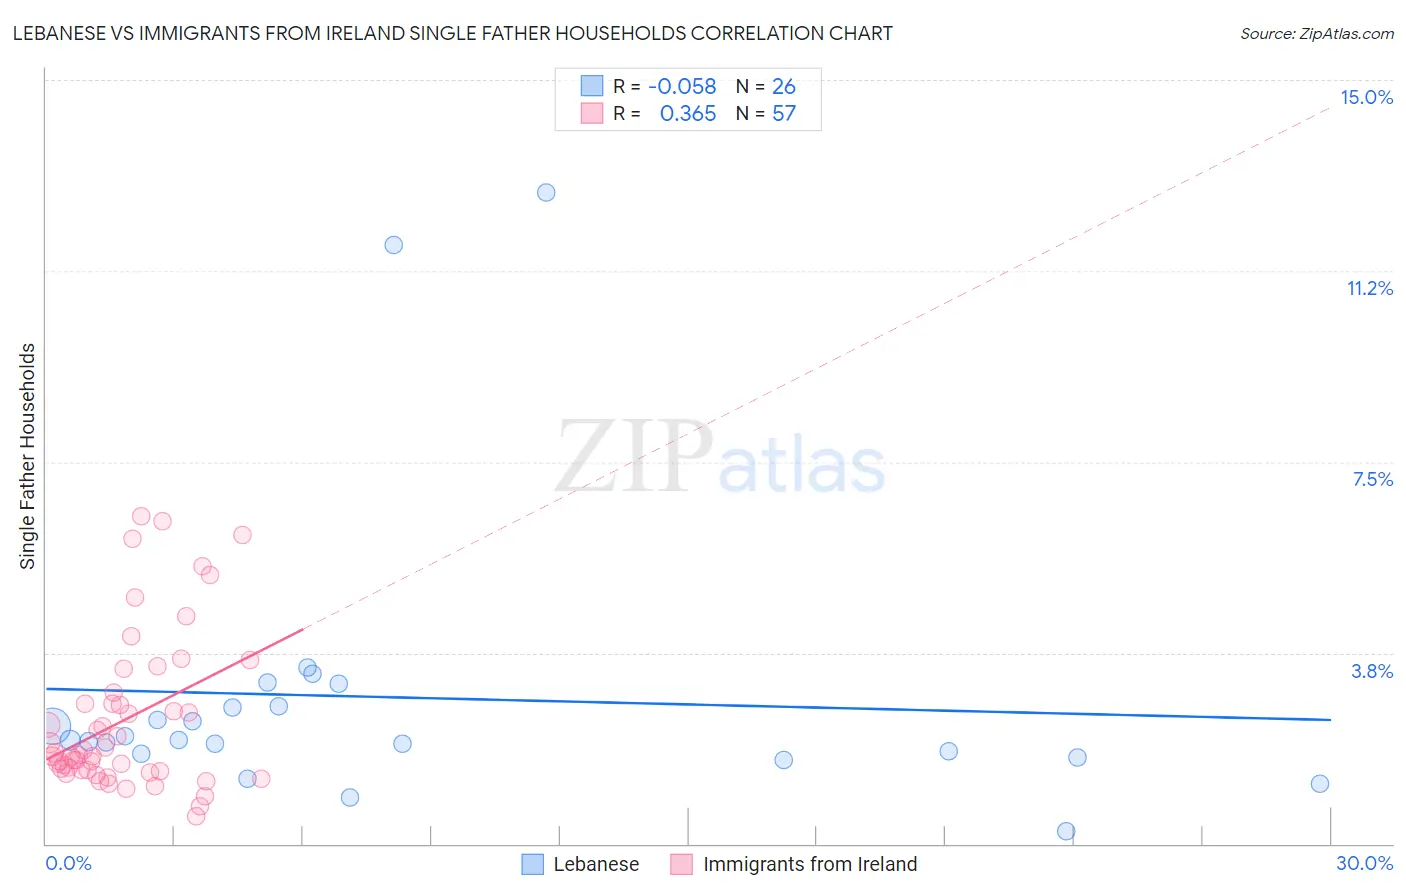
Lebanese vs Immigrants from Ireland Single Father Households Correlation Chart
The statistical analysis conducted on geographies consisting of 397,908,440 people shows a slight negative correlation between the proportion of Lebanese and percentage of single father households in the United States with a correlation coefficient (R) of -0.058 and weighted average of 2.1%. Similarly, the statistical analysis conducted on geographies consisting of 238,803,788 people shows a mild positive correlation between the proportion of Immigrants from Ireland and percentage of single father households in the United States with a correlation coefficient (R) of 0.365 and weighted average of 1.8%, a difference of 16.4%.
Single Father Households Correlation Summary
| Measurement | Lebanese | Immigrants from Ireland |
| Minimum | 0.25% | 0.53% |
| Maximum | 12.8% | 6.4% |
| Range | 12.5% | 5.9% |
| Mean | 2.9% | 2.4% |
| Median | 2.0% | 1.7% |
| Interquartile 25% (IQ1) | 1.8% | 1.4% |
| Interquartile 75% (IQ3) | 2.7% | 2.9% |
| Interquartile Range (IQR) | 0.94% | 1.4% |
| Standard Deviation (Sample) | 2.9% | 1.5% |
| Standard Deviation (Population) | 2.8% | 1.5% |
Similar Demographics by Single Father Households
Demographics Similar to Lebanese by Single Father Households
In terms of single father households, the demographic groups most similar to Lebanese are Argentinean (2.1%, a difference of 0.020%), Alsatian (2.1%, a difference of 0.020%), Immigrants from Western Europe (2.1%, a difference of 0.050%), Immigrants from Northern Africa (2.1%, a difference of 0.20%), and South African (2.1%, a difference of 0.35%).
| Demographics | Rating | Rank | Single Father Households |
| Arabs | 99.2 /100 | #96 | Exceptional 2.1% |
| Immigrants | Moldova | 99.1 /100 | #97 | Exceptional 2.1% |
| Guyanese | 99.1 /100 | #98 | Exceptional 2.1% |
| South Africans | 99.1 /100 | #99 | Exceptional 2.1% |
| Immigrants | Northern Africa | 99.0 /100 | #100 | Exceptional 2.1% |
| Immigrants | Western Europe | 98.9 /100 | #101 | Exceptional 2.1% |
| Argentineans | 98.9 /100 | #102 | Exceptional 2.1% |
| Lebanese | 98.9 /100 | #103 | Exceptional 2.1% |
| Alsatians | 98.9 /100 | #104 | Exceptional 2.1% |
| Palestinians | 98.6 /100 | #105 | Exceptional 2.2% |
| Immigrants | Southern Europe | 98.6 /100 | #106 | Exceptional 2.2% |
| Slovenes | 98.5 /100 | #107 | Exceptional 2.2% |
| Immigrants | Netherlands | 98.5 /100 | #108 | Exceptional 2.2% |
| Barbadians | 98.4 /100 | #109 | Exceptional 2.2% |
| Italians | 98.3 /100 | #110 | Exceptional 2.2% |
Demographics Similar to Immigrants from Ireland by Single Father Households
In terms of single father households, the demographic groups most similar to Immigrants from Ireland are Cypriot (1.8%, a difference of 0.11%), Immigrants from China (1.8%, a difference of 0.14%), Immigrants from Taiwan (1.8%, a difference of 0.27%), Okinawan (1.9%, a difference of 0.50%), and Immigrants from Hong Kong (1.8%, a difference of 0.63%).
| Demographics | Rating | Rank | Single Father Households |
| Soviet Union | 100.0 /100 | #1 | Exceptional 1.8% |
| Immigrants | Israel | 100.0 /100 | #2 | Exceptional 1.8% |
| Filipinos | 100.0 /100 | #3 | Exceptional 1.8% |
| Immigrants | Uzbekistan | 100.0 /100 | #4 | Exceptional 1.8% |
| Immigrants | Hong Kong | 100.0 /100 | #5 | Exceptional 1.8% |
| Immigrants | Taiwan | 100.0 /100 | #6 | Exceptional 1.8% |
| Cypriots | 100.0 /100 | #7 | Exceptional 1.8% |
| Immigrants | Ireland | 100.0 /100 | #8 | Exceptional 1.8% |
| Immigrants | China | 100.0 /100 | #9 | Exceptional 1.8% |
| Okinawans | 100.0 /100 | #10 | Exceptional 1.9% |
| Immigrants | Belarus | 100.0 /100 | #11 | Exceptional 1.9% |
| Immigrants | Greece | 100.0 /100 | #12 | Exceptional 1.9% |
| Immigrants | Singapore | 100.0 /100 | #13 | Exceptional 1.9% |
| Immigrants | Lithuania | 100.0 /100 | #14 | Exceptional 1.9% |
| Immigrants | Eastern Asia | 100.0 /100 | #15 | Exceptional 1.9% |