Lebanese vs Immigrants from Ireland Disability Age 35 to 64

COMPARE

Lebanese
Race
Ancestry
AfghanAfricanAlaska NativeAlaskan AthabascanAlbanianAleutAlsatianAmericanApacheArabArapahoArgentineanArmenianAssyrian/Chaldean/SyriacAustralianAustrianBahamianBangladeshiBarbadianBasqueBelgianBelizeanBermudanBhutaneseBlackfeetBolivianBrazilianBritishBritish West IndianBulgarianBurmeseCajunCambodianCanadianCape VerdeanCarpatho RusynCelticCentral AmericanCentral American IndianCherokeeCheyenneChickasawChileanChineseChippewaChoctawColombianColvilleComancheCosta RicanCreeCreekCroatianCrowCubanCypriotCzechCzechoslovakianDanishDelawareDominicanDutchDutch West IndianEastern EuropeanEcuadorianEgyptianEnglishEstonianEthiopianEuropeanFijianFilipinoFinnishFrenchFrench American IndianFrench CanadianGermanGerman RussianGhanaianGreekGuamanian/ChamorroGuatemalanGuyaneseHaitianHmongHonduranHopiHoumaHungarianIcelanderIndian (Asian)IndonesianInupiatIranianIraqiIrishIroquoisIsraeliItalianJamaicanJapaneseJordanianKenyanKiowaKoreanLaotianLatvianLebaneseLiberianLithuanianLumbeeLuxembourgerMacedonianMalaysianMalteseMarshalleseMenomineeMexicanMexican American IndianMongolianMoroccanNative HawaiianNavajoNepaleseNew ZealanderNicaraguanNigerianNorthern EuropeanNorwegianOkinawanOsageOttawaPaiutePakistaniPalestinianPanamanianParaguayanPennsylvania GermanPeruvianPimaPolishPortuguesePotawatomiPuebloPuerto RicanPuget Sound SalishRomanianRussianSalvadoranSamoanScandinavianScotch-IrishScottishSeminoleSenegaleseSerbianShoshoneSierra LeoneanSiouxSlavicSlovakSloveneSomaliSouth AfricanSouth AmericanSouth American IndianSoviet UnionSpaniardSpanishSpanish AmericanSpanish American IndianSri LankanSubsaharan AfricanSudaneseSwedishSwissSyrianTaiwaneseThaiTlingit-HaidaTohono O'OdhamTonganTrinidadian and TobagonianTsimshianTurkishU.S. Virgin IslanderUgandanUkrainianUruguayanUteVenezuelanVietnameseWelshWest IndianYakamaYaquiYugoslavianYumanYup'ikZimbabwean
Immigration
NonimmigrantsImmigrantsAfghanistanAfricaAlbaniaArgentinaArmeniaAsiaAustraliaAustriaBahamasBangladeshBarbadosBelarusBelgiumBelizeBoliviaBosnia and HerzegovinaBrazilBulgariaBurma/MyanmarCabo VerdeCambodiaCameroonCanadaCaribbeanCentral AmericaChileChinaColombiaCongoCosta RicaCroatiaCubaCzechoslovakiaDenmarkDominicaDominican RepublicEastern AfricaEastern AsiaEastern EuropeEcuadorEgyptEl SalvadorEnglandEritreaEthiopiaEuropeFijiFranceGermanyGhanaGreeceGrenadaGuatemalaGuyanaHaitiHondurasHong KongHungaryIndiaIndonesiaIranIraqIsraelItalyJamaicaJapanJordanKazakhstanKenyaKoreaKuwaitLaosLatin AmericaLatviaLebanonLiberiaLithuaniaMalaysiaMexicoMicronesiaMiddle AfricaMoldovaMoroccoNepalNetherlandsNicaraguaNigeriaNorth AmericaNorth MacedoniaNorthern AfricaNorthern EuropeNorwayOceaniaPakistanPanamaPeruPhilippinesPolandPortugalRomaniaRussiaSaudi ArabiaScotlandSenegalSerbiaSierra LeoneSingaporeSomaliaSouth AfricaSouth AmericaSouth Central AsiaSouth Eastern AsiaSouthern EuropeSpainSri LankaSt. Vincent and the GrenadinesSudanSwedenSwitzerlandSyriaTaiwanThailandTrinidad and TobagoTurkeyUgandaUkraineUruguayUzbekistanVenezuelaVietnamWest IndiesWestern AfricaWestern AsiaWestern EuropeYemenZaireZimbabweAzores
Immigrants from Ireland
Race
Ancestry
AfghanAfricanAlaska NativeAlaskan AthabascanAlbanianAleutAlsatianAmericanApacheArabArapahoArgentineanArmenianAssyrian/Chaldean/SyriacAustralianAustrianBahamianBangladeshiBarbadianBasqueBelgianBelizeanBermudanBhutaneseBlackfeetBolivianBrazilianBritishBritish West IndianBulgarianBurmeseCajunCambodianCanadianCape VerdeanCarpatho RusynCelticCentral AmericanCentral American IndianCherokeeCheyenneChickasawChileanChineseChippewaChoctawColombianColvilleComancheCosta RicanCreeCreekCroatianCrowCubanCypriotCzechCzechoslovakianDanishDelawareDominicanDutchDutch West IndianEastern EuropeanEcuadorianEgyptianEnglishEstonianEthiopianEuropeanFijianFilipinoFinnishFrenchFrench American IndianFrench CanadianGermanGerman RussianGhanaianGreekGuamanian/ChamorroGuatemalanGuyaneseHaitianHmongHonduranHopiHoumaHungarianIcelanderIndian (Asian)IndonesianInupiatIranianIraqiIrishIroquoisIsraeliItalianJamaicanJapaneseJordanianKenyanKiowaKoreanLaotianLatvianLiberianLithuanianLumbeeLuxembourgerMacedonianMalaysianMalteseMarshalleseMenomineeMexicanMexican American IndianMongolianMoroccanNative HawaiianNavajoNepaleseNew ZealanderNicaraguanNigerianNorthern EuropeanNorwegianOkinawanOsageOttawaPaiutePakistaniPalestinianPanamanianParaguayanPennsylvania GermanPeruvianPimaPolishPortuguesePotawatomiPuebloPuerto RicanPuget Sound SalishRomanianRussianSalvadoranSamoanScandinavianScotch-IrishScottishSeminoleSenegaleseSerbianShoshoneSierra LeoneanSiouxSlavicSlovakSloveneSomaliSouth AfricanSouth AmericanSouth American IndianSoviet UnionSpaniardSpanishSpanish AmericanSpanish American IndianSri LankanSubsaharan AfricanSudaneseSwedishSwissSyrianTaiwaneseThaiTlingit-HaidaTohono O'OdhamTonganTrinidadian and TobagonianTsimshianTurkishU.S. Virgin IslanderUgandanUkrainianUruguayanUteVenezuelanVietnameseWelshWest IndianYakamaYaquiYugoslavianYumanYup'ikZimbabwean
Immigration
NonimmigrantsImmigrantsAfghanistanAfricaAlbaniaArgentinaArmeniaAsiaAustraliaAustriaBahamasBangladeshBarbadosBelarusBelgiumBelizeBoliviaBosnia and HerzegovinaBrazilBulgariaBurma/MyanmarCabo VerdeCambodiaCameroonCanadaCaribbeanCentral AmericaChileChinaColombiaCongoCosta RicaCroatiaCubaCzechoslovakiaDenmarkDominicaDominican RepublicEastern AfricaEastern AsiaEastern EuropeEcuadorEgyptEl SalvadorEnglandEritreaEthiopiaEuropeFijiFranceGermanyGhanaGreeceGrenadaGuatemalaGuyanaHaitiHondurasHong KongHungaryIndiaIndonesiaIranIraqIrelandIsraelItalyJamaicaJapanJordanKazakhstanKenyaKoreaKuwaitLaosLatin AmericaLatviaLebanonLiberiaLithuaniaMalaysiaMexicoMicronesiaMiddle AfricaMoldovaMoroccoNepalNetherlandsNicaraguaNigeriaNorth AmericaNorth MacedoniaNorthern AfricaNorthern EuropeNorwayOceaniaPakistanPanamaPeruPhilippinesPolandPortugalRomaniaRussiaSaudi ArabiaScotlandSenegalSerbiaSierra LeoneSingaporeSomaliaSouth AfricaSouth AmericaSouth Central AsiaSouth Eastern AsiaSouthern EuropeSpainSri LankaSt. Vincent and the GrenadinesSudanSwedenSwitzerlandSyriaTaiwanThailandTrinidad and TobagoTurkeyUgandaUkraineUruguayUzbekistanVenezuelaVietnamWest IndiesWestern AfricaWestern AsiaWestern EuropeYemenZaireZimbabweAzores
Disability Age 35 to 64
Income
Poverty
Unemployment
Labor Participation
Family Structure
Vehicle Availability
Education Level
Disability

Disability Age 35 to 64 Comparison

Lebanese

Immigrants from Ireland

Average
Exceptional
11.3%
DISABILITY AGE 35 TO 64
51.8/ 100
METRIC RATING
173rd/ 347
METRIC RANK
9.5%
DISABILITY AGE 35 TO 64
100.0/ 100
METRIC RATING
29th/ 347
METRIC RANK

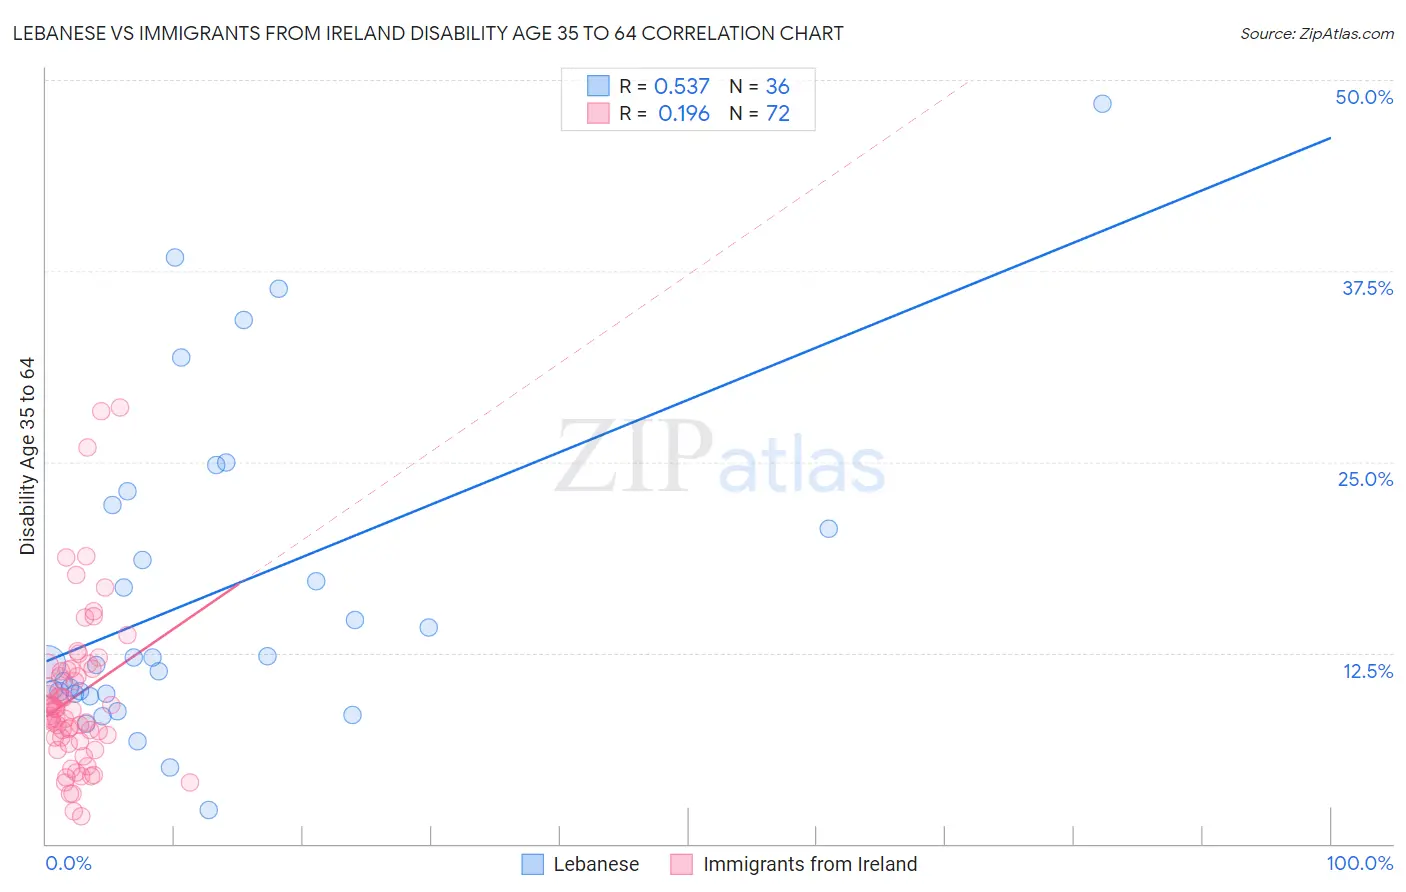
Lebanese vs Immigrants from Ireland Disability Age 35 to 64 Correlation Chart

The statistical analysis conducted on geographies consisting of 401,283,534 people shows a substantial positive correlation between the proportion of Lebanese and percentage of population with a disability between the ages 34 and 64 in the United States with a correlation coefficient (R) of 0.537 and weighted average of 11.3%. Similarly, the statistical analysis conducted on geographies consisting of 240,729,151 people shows a poor positive correlation between the proportion of Immigrants from Ireland and percentage of population with a disability between the ages 34 and 64 in the United States with a correlation coefficient (R) of 0.196 and weighted average of 9.5%, a difference of 18.0%.
Lebanese vs Immigrants from Ireland Disability Age 35 to 64

Disability Age 35 to 64 Correlation Summary

MeasurementLebaneseImmigrants from Ireland
Minimum2.2%1.8%
Maximum48.5%28.6%
Range46.2%26.8%
Mean16.3%9.7%
Median12.0%8.8%
Interquartile 25% (IQ1)9.8%6.8%
Interquartile 75% (IQ3)21.4%11.4%
Interquartile Range (IQR)11.6%4.6%
Standard Deviation (Sample)10.5%5.3%
Standard Deviation (Population)10.4%5.2%

Similar Demographics by Disability Age 35 to 64

Demographics Similar to Lebanese by Disability Age 35 to 64

In terms of disability age 35 to 64, the demographic groups most similar to Lebanese are Immigrants from Fiji (11.3%, a difference of 0.14%), Italian (11.2%, a difference of 0.31%), Czech (11.3%, a difference of 0.31%), Immigrants from Trinidad and Tobago (11.2%, a difference of 0.34%), and Immigrants from Uganda (11.2%, a difference of 0.51%).
DemographicsRating | RankDisability Age 35 to 64
Immigrants | Haiti
63.8
/100
|
#166
Good
11.1%
Austrians
63.2
/100
|
#167
Good
11.1%
Central Americans
59.1
/100
|
#168
Average
11.2%
Haitians
59.0
/100
|
#169
Average
11.2%
Immigrants | Uganda
58.0
/100
|
#170
Average
11.2%
Immigrants | Trinidad and Tobago
55.9
/100
|
#171
Average
11.2%
Italians
55.6
/100
|
#172
Average
11.2%
Lebanese
51.8
/100
|
#173
Average
11.3%
Immigrants | Fiji
50.0
/100
|
#174
Average
11.3%
Czechs
47.9
/100
|
#175
Average
11.3%
Ugandans
43.7
/100
|
#176
Average
11.3%
Immigrants | Eastern Africa
42.2
/100
|
#177
Average
11.3%
Poles
42.0
/100
|
#178
Average
11.3%
Immigrants | Barbados
41.6
/100
|
#179
Average
11.3%
Immigrants | Caribbean
41.5
/100
|
#180
Average
11.3%

Demographics Similar to Immigrants from Ireland by Disability Age 35 to 64

In terms of disability age 35 to 64, the demographic groups most similar to Immigrants from Ireland are Immigrants from Japan (9.5%, a difference of 0.040%), Immigrants from Pakistan (9.5%, a difference of 0.45%), Immigrants from Lithuania (9.6%, a difference of 0.53%), Immigrants from Asia (9.5%, a difference of 0.62%), and Immigrants from Sri Lanka (9.5%, a difference of 0.84%).
DemographicsRating | RankDisability Age 35 to 64
Cypriots
100.0
/100
|
#22
Exceptional
9.4%
Argentineans
100.0
/100
|
#23
Exceptional
9.4%
Asians
100.0
/100
|
#24
Exceptional
9.4%
Venezuelans
100.0
/100
|
#25
Exceptional
9.4%
Immigrants | Sri Lanka
100.0
/100
|
#26
Exceptional
9.5%
Immigrants | Asia
100.0
/100
|
#27
Exceptional
9.5%
Immigrants | Pakistan
100.0
/100
|
#28
Exceptional
9.5%
Immigrants | Ireland
100.0
/100
|
#29
Exceptional
9.5%
Immigrants | Japan
100.0
/100
|
#30
Exceptional
9.5%
Immigrants | Lithuania
99.9
/100
|
#31
Exceptional
9.6%
Turks
99.9
/100
|
#32
Exceptional
9.7%
Immigrants | Indonesia
99.9
/100
|
#33
Exceptional
9.7%
Immigrants | Australia
99.9
/100
|
#34
Exceptional
9.7%
Bulgarians
99.9
/100
|
#35
Exceptional
9.7%
Immigrants | Cuba
99.9
/100
|
#36
Exceptional
9.7%