Central American vs Immigrants from Ireland 3 or more Vehicles in Household
COMPARE
Central American
Immigrants from Ireland
3 or more Vehicles in Household
3 or more Vehicles in Household Comparison
Central Americans
Immigrants from Ireland
20.5%
3 OR MORE VEHICLES IN HOUSEHOLD
93.1/ 100
METRIC RATING
124th/ 347
METRIC RANK
17.3%
3 OR MORE VEHICLES IN HOUSEHOLD
0.3/ 100
METRIC RATING
282nd/ 347
METRIC RANK
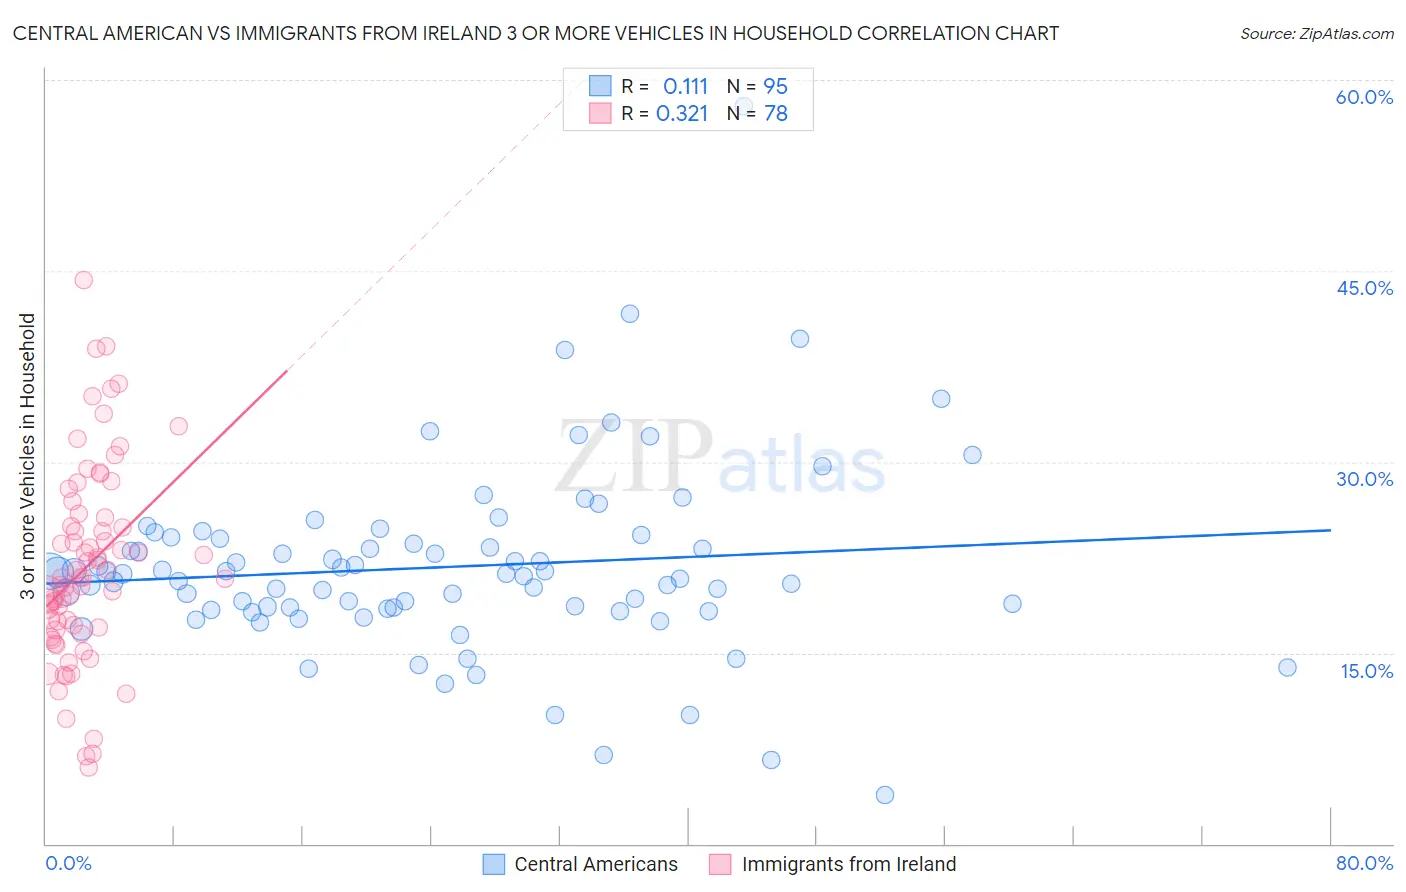
Central American vs Immigrants from Ireland 3 or more Vehicles in Household Correlation Chart
The statistical analysis conducted on geographies consisting of 503,902,726 people shows a poor positive correlation between the proportion of Central Americans and percentage of households with 3 or more vehicles available in the United States with a correlation coefficient (R) of 0.111 and weighted average of 20.5%. Similarly, the statistical analysis conducted on geographies consisting of 240,727,635 people shows a mild positive correlation between the proportion of Immigrants from Ireland and percentage of households with 3 or more vehicles available in the United States with a correlation coefficient (R) of 0.321 and weighted average of 17.3%, a difference of 18.0%.
3 or more Vehicles in Household Correlation Summary
| Measurement | Central American | Immigrants from Ireland |
| Minimum | 3.8% | 6.0% |
| Maximum | 57.9% | 44.3% |
| Range | 54.0% | 38.3% |
| Mean | 21.7% | 21.7% |
| Median | 21.2% | 20.9% |
| Interquartile 25% (IQ1) | 18.5% | 16.8% |
| Interquartile 75% (IQ3) | 24.0% | 25.6% |
| Interquartile Range (IQR) | 5.5% | 8.8% |
| Standard Deviation (Sample) | 7.4% | 7.8% |
| Standard Deviation (Population) | 7.3% | 7.7% |
Similar Demographics by 3 or more Vehicles in Household
Demographics Similar to Central Americans by 3 or more Vehicles in Household
In terms of 3 or more vehicles in household, the demographic groups most similar to Central Americans are Immigrants from Netherlands (20.4%, a difference of 0.030%), Immigrants from Korea (20.5%, a difference of 0.17%), German Russian (20.5%, a difference of 0.18%), Immigrants from Thailand (20.5%, a difference of 0.22%), and Maltese (20.5%, a difference of 0.24%).
| Demographics | Rating | Rank | 3 or more Vehicles in Household |
| Croatians | 94.9 /100 | #117 | Exceptional 20.6% |
| Costa Ricans | 94.6 /100 | #118 | Exceptional 20.6% |
| Immigrants | Latin America | 94.5 /100 | #119 | Exceptional 20.5% |
| Maltese | 93.9 /100 | #120 | Exceptional 20.5% |
| Immigrants | Thailand | 93.8 /100 | #121 | Exceptional 20.5% |
| German Russians | 93.7 /100 | #122 | Exceptional 20.5% |
| Immigrants | Korea | 93.7 /100 | #123 | Exceptional 20.5% |
| Central Americans | 93.1 /100 | #124 | Exceptional 20.5% |
| Immigrants | Netherlands | 92.9 /100 | #125 | Exceptional 20.4% |
| Slavs | 92.1 /100 | #126 | Exceptional 20.4% |
| Immigrants | Bolivia | 92.0 /100 | #127 | Exceptional 20.4% |
| New Zealanders | 91.3 /100 | #128 | Exceptional 20.4% |
| Zimbabweans | 88.7 /100 | #129 | Excellent 20.3% |
| Greeks | 88.6 /100 | #130 | Excellent 20.3% |
| Immigrants | Asia | 88.1 /100 | #131 | Excellent 20.2% |
Demographics Similar to Immigrants from Ireland by 3 or more Vehicles in Household
In terms of 3 or more vehicles in household, the demographic groups most similar to Immigrants from Ireland are Black/African American (17.3%, a difference of 0.050%), Immigrants from Colombia (17.3%, a difference of 0.17%), Immigrants from Latvia (17.4%, a difference of 0.29%), Immigrants from Eastern Europe (17.4%, a difference of 0.33%), and Immigrants from Kazakhstan (17.4%, a difference of 0.37%).
| Demographics | Rating | Rank | 3 or more Vehicles in Household |
| Immigrants | Ukraine | 0.4 /100 | #275 | Tragic 17.5% |
| Okinawans | 0.4 /100 | #276 | Tragic 17.4% |
| Brazilians | 0.4 /100 | #277 | Tragic 17.4% |
| Immigrants | Bahamas | 0.3 /100 | #278 | Tragic 17.4% |
| Immigrants | Kazakhstan | 0.3 /100 | #279 | Tragic 17.4% |
| Immigrants | Eastern Europe | 0.3 /100 | #280 | Tragic 17.4% |
| Immigrants | Latvia | 0.3 /100 | #281 | Tragic 17.4% |
| Immigrants | Ireland | 0.3 /100 | #282 | Tragic 17.3% |
| Blacks/African Americans | 0.3 /100 | #283 | Tragic 17.3% |
| Immigrants | Colombia | 0.3 /100 | #284 | Tragic 17.3% |
| Immigrants | Croatia | 0.2 /100 | #285 | Tragic 17.2% |
| Menominee | 0.2 /100 | #286 | Tragic 17.2% |
| Immigrants | Brazil | 0.2 /100 | #287 | Tragic 17.1% |
| Immigrants | Uruguay | 0.2 /100 | #288 | Tragic 17.1% |
| Immigrants | Liberia | 0.1 /100 | #289 | Tragic 17.1% |