Maltese vs Pima 4 or more Vehicles in Household
COMPARE
Maltese
Pima
4 or more Vehicles in Household
4 or more Vehicles in Household Comparison
Maltese
Pima
6.7%
4 OR MORE VEHICLES IN HOUSEHOLD
88.4/ 100
METRIC RATING
131st/ 347
METRIC RANK
7.9%
4 OR MORE VEHICLES IN HOUSEHOLD
100.0/ 100
METRIC RATING
41st/ 347
METRIC RANK
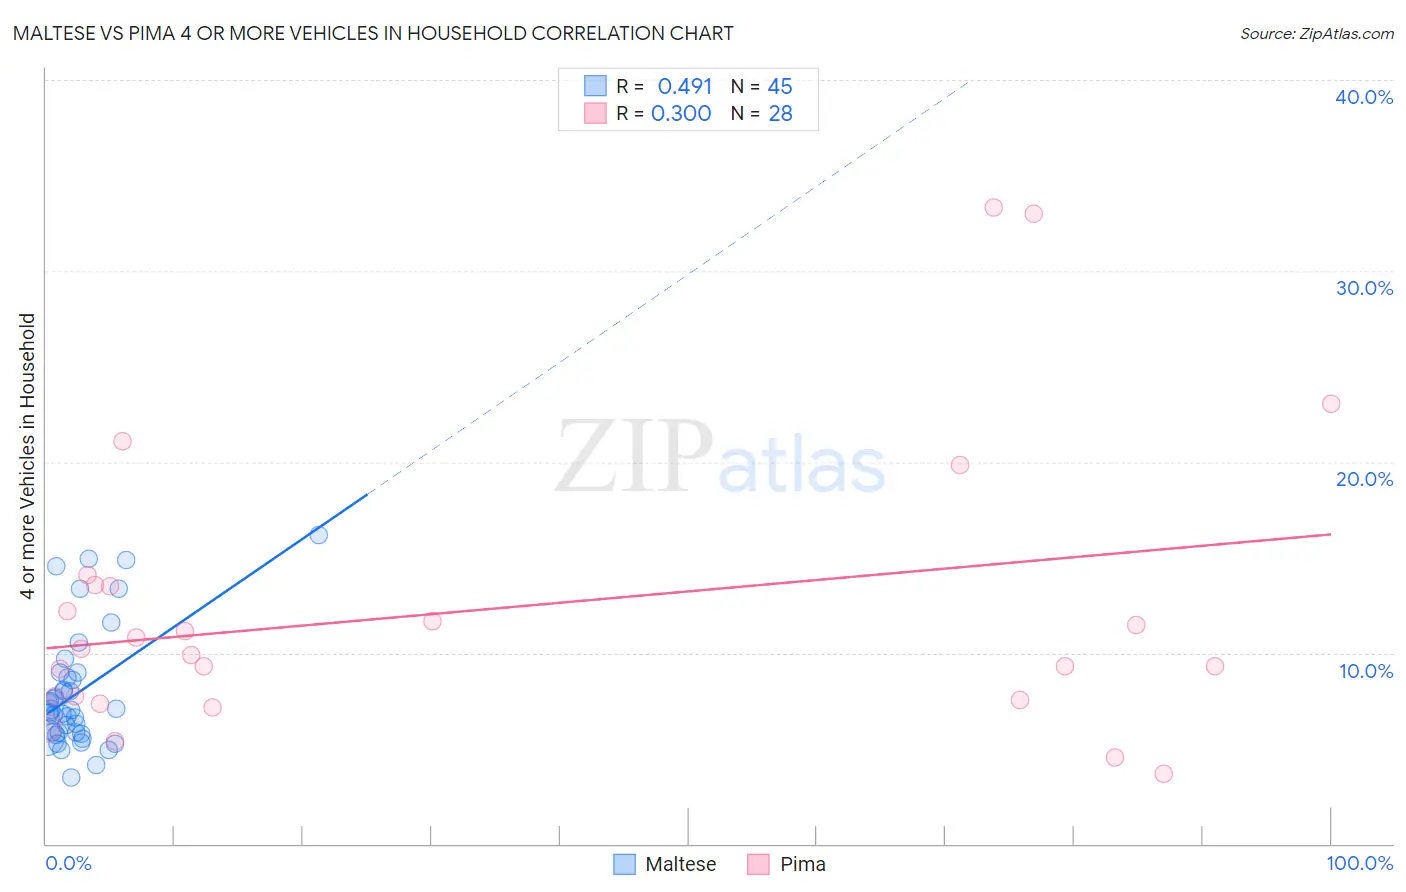
Maltese vs Pima 4 or more Vehicles in Household Correlation Chart
The statistical analysis conducted on geographies consisting of 125,931,665 people shows a moderate positive correlation between the proportion of Maltese and percentage of households with 4 or more vehicles available in the United States with a correlation coefficient (R) of 0.491 and weighted average of 6.7%. Similarly, the statistical analysis conducted on geographies consisting of 61,524,905 people shows a weak positive correlation between the proportion of Pima and percentage of households with 4 or more vehicles available in the United States with a correlation coefficient (R) of 0.300 and weighted average of 7.9%, a difference of 18.3%.
4 or more Vehicles in Household Correlation Summary
| Measurement | Maltese | Pima |
| Minimum | 3.5% | 3.7% |
| Maximum | 16.2% | 33.3% |
| Range | 12.7% | 29.7% |
| Mean | 7.9% | 12.2% |
| Median | 7.0% | 10.0% |
| Interquartile 25% (IQ1) | 5.8% | 7.6% |
| Interquartile 75% (IQ3) | 8.8% | 13.5% |
| Interquartile Range (IQR) | 3.0% | 5.9% |
| Standard Deviation (Sample) | 3.1% | 7.5% |
| Standard Deviation (Population) | 3.1% | 7.4% |
Similar Demographics by 4 or more Vehicles in Household
Demographics Similar to Maltese by 4 or more Vehicles in Household
In terms of 4 or more vehicles in household, the demographic groups most similar to Maltese are Immigrants from Netherlands (6.6%, a difference of 0.14%), Immigrants from Scotland (6.7%, a difference of 0.15%), Armenian (6.6%, a difference of 0.34%), Ottawa (6.6%, a difference of 0.35%), and Tohono O'odham (6.6%, a difference of 0.38%).
| Demographics | Rating | Rank | 4 or more Vehicles in Household |
| Immigrants | Asia | 94.4 /100 | #124 | Exceptional 6.8% |
| Austrians | 94.1 /100 | #125 | Exceptional 6.8% |
| Belgians | 94.1 /100 | #126 | Exceptional 6.8% |
| Immigrants | Korea | 93.8 /100 | #127 | Exceptional 6.8% |
| Immigrants | Bolivia | 92.5 /100 | #128 | Exceptional 6.7% |
| Immigrants | England | 92.0 /100 | #129 | Exceptional 6.7% |
| Immigrants | Scotland | 89.0 /100 | #130 | Excellent 6.7% |
| Maltese | 88.4 /100 | #131 | Excellent 6.7% |
| Immigrants | Netherlands | 87.8 /100 | #132 | Excellent 6.6% |
| Armenians | 86.9 /100 | #133 | Excellent 6.6% |
| Ottawa | 86.9 /100 | #134 | Excellent 6.6% |
| Tohono O'odham | 86.7 /100 | #135 | Excellent 6.6% |
| Luxembourgers | 86.4 /100 | #136 | Excellent 6.6% |
| French Canadians | 85.4 /100 | #137 | Excellent 6.6% |
| Italians | 84.5 /100 | #138 | Excellent 6.6% |
Demographics Similar to Pima by 4 or more Vehicles in Household
In terms of 4 or more vehicles in household, the demographic groups most similar to Pima are Salvadoran (7.8%, a difference of 0.49%), Spanish (7.9%, a difference of 0.57%), Fijian (7.8%, a difference of 0.60%), Bhutanese (7.8%, a difference of 0.86%), and Choctaw (7.8%, a difference of 0.92%).
| Demographics | Rating | Rank | 4 or more Vehicles in Household |
| Alaskan Athabascans | 100.0 /100 | #34 | Exceptional 8.1% |
| Guamanians/Chamorros | 100.0 /100 | #35 | Exceptional 8.1% |
| Norwegians | 100.0 /100 | #36 | Exceptional 8.0% |
| Scandinavians | 100.0 /100 | #37 | Exceptional 8.0% |
| Sioux | 100.0 /100 | #38 | Exceptional 8.0% |
| Spanish Americans | 100.0 /100 | #39 | Exceptional 8.0% |
| Spanish | 100.0 /100 | #40 | Exceptional 7.9% |
| Pima | 100.0 /100 | #41 | Exceptional 7.9% |
| Salvadorans | 100.0 /100 | #42 | Exceptional 7.8% |
| Fijians | 100.0 /100 | #43 | Exceptional 7.8% |
| Bhutanese | 100.0 /100 | #44 | Exceptional 7.8% |
| Choctaw | 100.0 /100 | #45 | Exceptional 7.8% |
| Crow | 100.0 /100 | #46 | Exceptional 7.8% |
| Osage | 100.0 /100 | #47 | Exceptional 7.8% |
| Swiss | 100.0 /100 | #48 | Exceptional 7.8% |