Kiowa vs Pima 1 or more Vehicles in Household
COMPARE
Kiowa
Pima
1 or more Vehicles in Household
1 or more Vehicles in Household Comparison
Kiowa
Pima
88.6%
1 OR MORE VEHICLES IN HOUSEHOLD
3.8/ 100
METRIC RATING
239th/ 347
METRIC RANK
86.3%
1 OR MORE VEHICLES IN HOUSEHOLD
0.0/ 100
METRIC RATING
291st/ 347
METRIC RANK
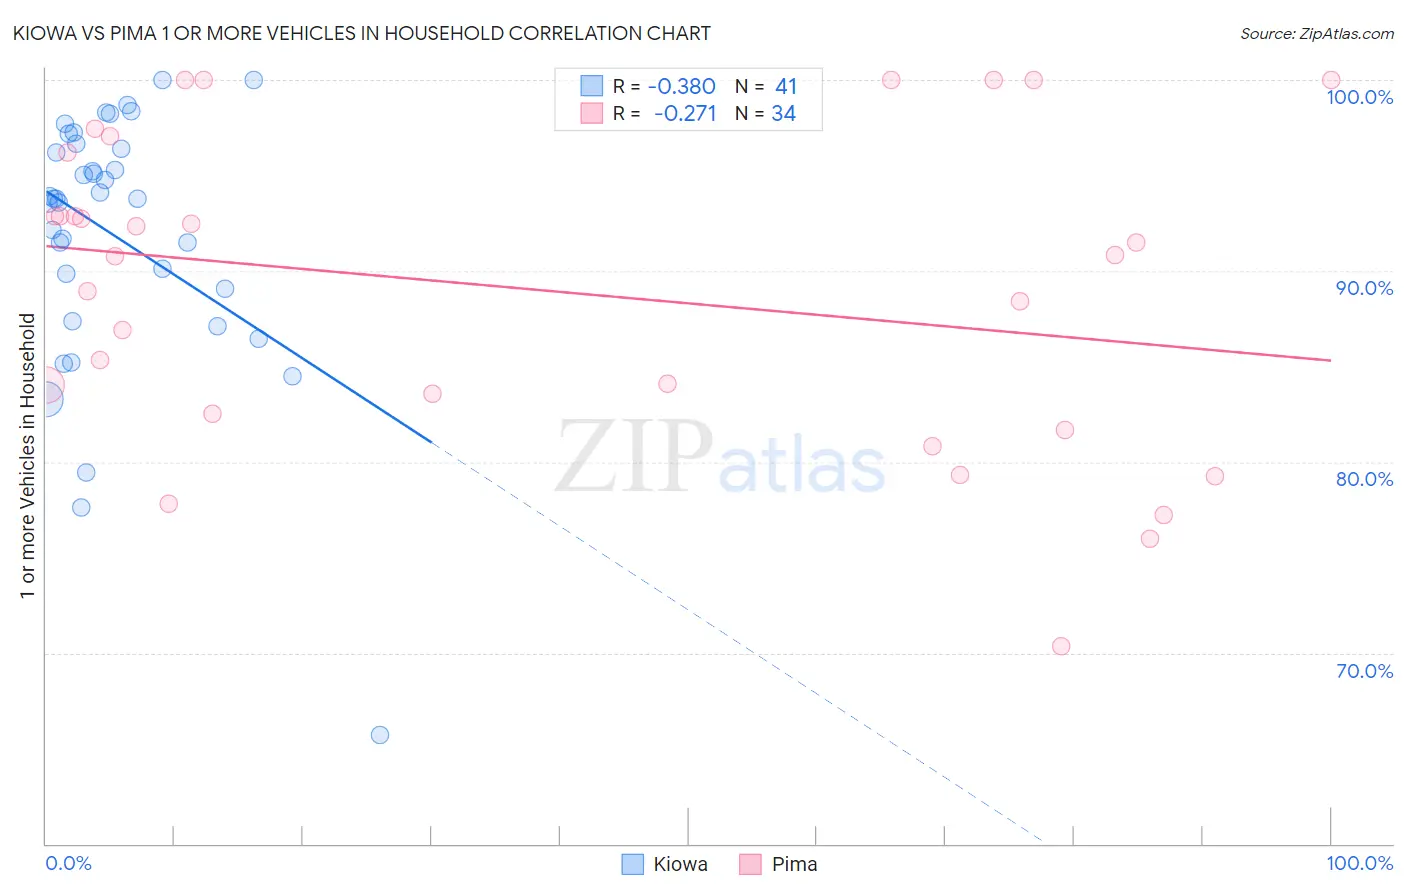
Kiowa vs Pima 1 or more Vehicles in Household Correlation Chart
The statistical analysis conducted on geographies consisting of 56,099,396 people shows a mild negative correlation between the proportion of Kiowa and percentage of households with 1 or more vehicles available in the United States with a correlation coefficient (R) of -0.380 and weighted average of 88.6%. Similarly, the statistical analysis conducted on geographies consisting of 61,539,566 people shows a weak negative correlation between the proportion of Pima and percentage of households with 1 or more vehicles available in the United States with a correlation coefficient (R) of -0.271 and weighted average of 86.3%, a difference of 2.6%.
1 or more Vehicles in Household Correlation Summary
| Measurement | Kiowa | Pima |
| Minimum | 65.7% | 70.4% |
| Maximum | 100.0% | 100.0% |
| Range | 34.3% | 29.6% |
| Mean | 91.8% | 89.0% |
| Median | 93.8% | 90.8% |
| Interquartile 25% (IQ1) | 88.2% | 82.5% |
| Interquartile 75% (IQ3) | 96.6% | 96.2% |
| Interquartile Range (IQR) | 8.4% | 13.6% |
| Standard Deviation (Sample) | 6.9% | 8.2% |
| Standard Deviation (Population) | 6.8% | 8.1% |
Similar Demographics by 1 or more Vehicles in Household
Demographics Similar to Kiowa by 1 or more Vehicles in Household
In terms of 1 or more vehicles in household, the demographic groups most similar to Kiowa are Immigrants from Somalia (88.6%, a difference of 0.040%), Immigrants from Turkey (88.6%, a difference of 0.060%), Immigrants from Pakistan (88.6%, a difference of 0.070%), Paiute (88.6%, a difference of 0.080%), and Immigrants from Peru (88.6%, a difference of 0.090%).
| Demographics | Rating | Rank | 1 or more Vehicles in Household |
| Immigrants | Japan | 4.9 /100 | #232 | Tragic 88.7% |
| Houma | 4.8 /100 | #233 | Tragic 88.6% |
| Immigrants | Peru | 4.7 /100 | #234 | Tragic 88.6% |
| Paiute | 4.6 /100 | #235 | Tragic 88.6% |
| Immigrants | Pakistan | 4.5 /100 | #236 | Tragic 88.6% |
| Immigrants | Turkey | 4.4 /100 | #237 | Tragic 88.6% |
| Immigrants | Somalia | 4.2 /100 | #238 | Tragic 88.6% |
| Kiowa | 3.8 /100 | #239 | Tragic 88.6% |
| Eastern Europeans | 3.0 /100 | #240 | Tragic 88.5% |
| Taiwanese | 2.6 /100 | #241 | Tragic 88.4% |
| Turks | 2.5 /100 | #242 | Tragic 88.4% |
| Immigrants | Belgium | 2.1 /100 | #243 | Tragic 88.4% |
| Immigrants | Portugal | 2.0 /100 | #244 | Tragic 88.3% |
| Immigrants | Czechoslovakia | 1.9 /100 | #245 | Tragic 88.3% |
| Menominee | 1.9 /100 | #246 | Tragic 88.3% |
Demographics Similar to Pima by 1 or more Vehicles in Household
In terms of 1 or more vehicles in household, the demographic groups most similar to Pima are Immigrants from Australia (86.4%, a difference of 0.080%), Immigrants from Ireland (86.4%, a difference of 0.12%), Hopi (86.4%, a difference of 0.14%), Immigrants from Malaysia (86.5%, a difference of 0.21%), and Okinawan (86.1%, a difference of 0.23%).
| Demographics | Rating | Rank | 1 or more Vehicles in Household |
| Central American Indians | 0.0 /100 | #284 | Tragic 86.7% |
| Immigrants | Kazakhstan | 0.0 /100 | #285 | Tragic 86.6% |
| Immigrants | Eastern Asia | 0.0 /100 | #286 | Tragic 86.5% |
| Immigrants | Malaysia | 0.0 /100 | #287 | Tragic 86.5% |
| Hopi | 0.0 /100 | #288 | Tragic 86.4% |
| Immigrants | Ireland | 0.0 /100 | #289 | Tragic 86.4% |
| Immigrants | Australia | 0.0 /100 | #290 | Tragic 86.4% |
| Pima | 0.0 /100 | #291 | Tragic 86.3% |
| Okinawans | 0.0 /100 | #292 | Tragic 86.1% |
| Indians (Asian) | 0.0 /100 | #293 | Tragic 86.0% |
| Alaskan Athabascans | 0.0 /100 | #294 | Tragic 86.0% |
| Immigrants | Jamaica | 0.0 /100 | #295 | Tragic 85.8% |
| Immigrants | Spain | 0.0 /100 | #296 | Tragic 85.8% |
| Paraguayans | 0.0 /100 | #297 | Tragic 85.7% |
| Belizeans | 0.0 /100 | #298 | Tragic 85.7% |