Kiowa vs Immigrants from Yemen 2 or more Vehicles in Household
COMPARE
Kiowa
Immigrants from Yemen
2 or more Vehicles in Household
2 or more Vehicles in Household Comparison
Kiowa
Immigrants from Yemen
53.9%
2 OR MORE VEHICLES IN HOUSEHOLD
6.2/ 100
METRIC RATING
222nd/ 347
METRIC RANK
42.8%
2 OR MORE VEHICLES IN HOUSEHOLD
0.0/ 100
METRIC RATING
327th/ 347
METRIC RANK
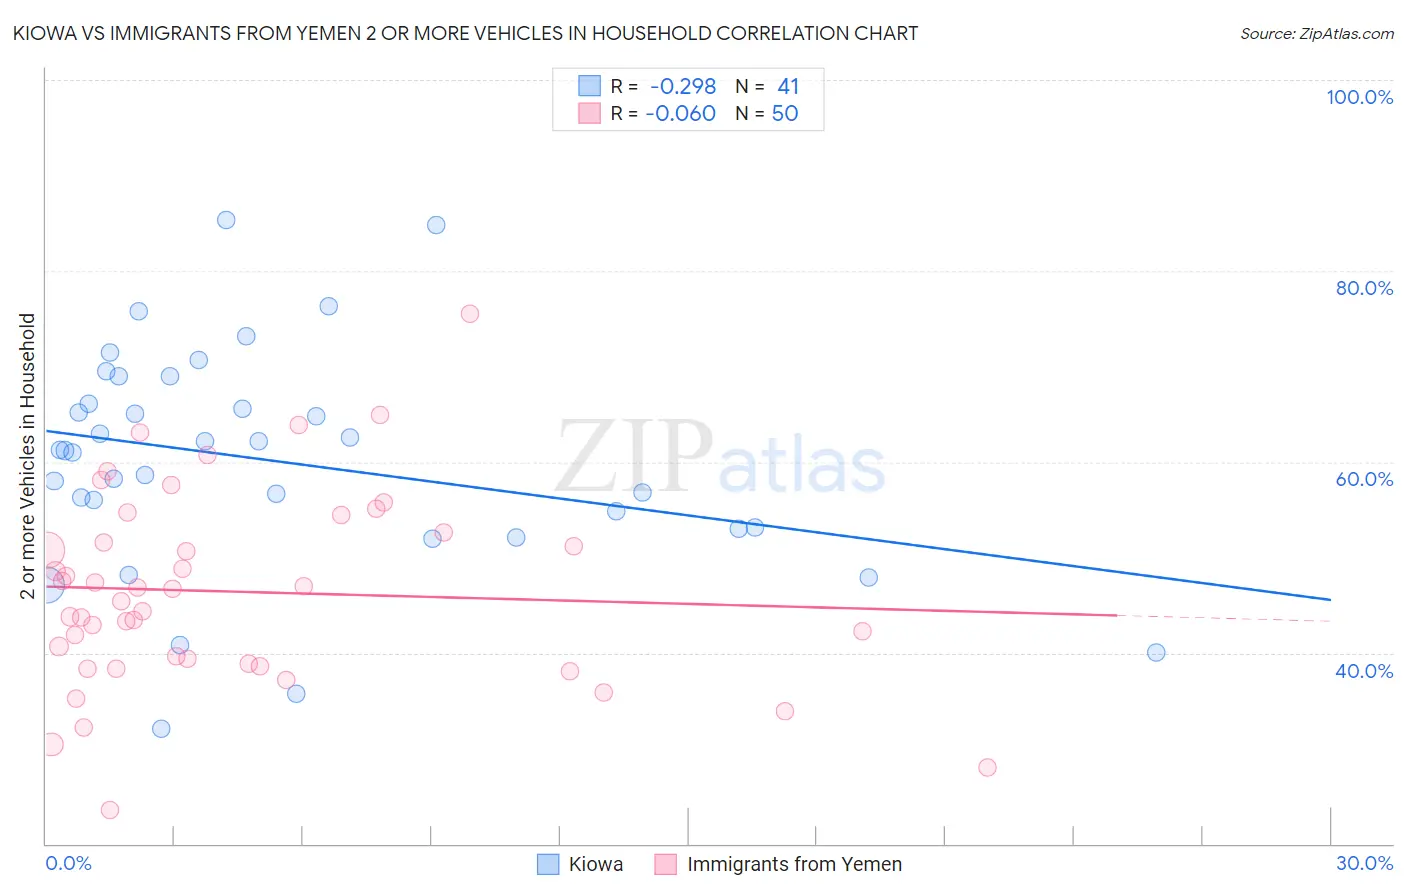
Kiowa vs Immigrants from Yemen 2 or more Vehicles in Household Correlation Chart
The statistical analysis conducted on geographies consisting of 56,099,396 people shows a weak negative correlation between the proportion of Kiowa and percentage of households with 2 or more vehicles available in the United States with a correlation coefficient (R) of -0.298 and weighted average of 53.9%. Similarly, the statistical analysis conducted on geographies consisting of 82,431,124 people shows a slight negative correlation between the proportion of Immigrants from Yemen and percentage of households with 2 or more vehicles available in the United States with a correlation coefficient (R) of -0.060 and weighted average of 42.8%, a difference of 25.7%.
2 or more Vehicles in Household Correlation Summary
| Measurement | Kiowa | Immigrants from Yemen |
| Minimum | 32.0% | 23.5% |
| Maximum | 85.3% | 75.5% |
| Range | 53.2% | 52.0% |
| Mean | 60.1% | 46.4% |
| Median | 61.2% | 46.0% |
| Interquartile 25% (IQ1) | 53.1% | 38.8% |
| Interquartile 75% (IQ3) | 67.5% | 52.6% |
| Interquartile Range (IQR) | 14.5% | 13.8% |
| Standard Deviation (Sample) | 11.7% | 10.3% |
| Standard Deviation (Population) | 11.6% | 10.2% |
Similar Demographics by 2 or more Vehicles in Household
Demographics Similar to Kiowa by 2 or more Vehicles in Household
In terms of 2 or more vehicles in household, the demographic groups most similar to Kiowa are Immigrants from Singapore (53.9%, a difference of 0.010%), Taiwanese (53.9%, a difference of 0.030%), South American Indian (53.9%, a difference of 0.050%), Immigrants from Argentina (53.9%, a difference of 0.11%), and Immigrants from Bosnia and Herzegovina (53.8%, a difference of 0.13%).
| Demographics | Rating | Rank | 2 or more Vehicles in Household |
| Aleuts | 9.3 /100 | #215 | Tragic 54.1% |
| Immigrants | Western Asia | 9.3 /100 | #216 | Tragic 54.1% |
| Immigrants | Burma/Myanmar | 7.1 /100 | #217 | Tragic 53.9% |
| Immigrants | Argentina | 6.8 /100 | #218 | Tragic 53.9% |
| South American Indians | 6.5 /100 | #219 | Tragic 53.9% |
| Taiwanese | 6.3 /100 | #220 | Tragic 53.9% |
| Immigrants | Singapore | 6.3 /100 | #221 | Tragic 53.9% |
| Kiowa | 6.2 /100 | #222 | Tragic 53.9% |
| Immigrants | Bosnia and Herzegovina | 5.5 /100 | #223 | Tragic 53.8% |
| Brazilians | 5.3 /100 | #224 | Tragic 53.8% |
| Immigrants | Egypt | 5.2 /100 | #225 | Tragic 53.8% |
| Immigrants | Eastern Africa | 5.1 /100 | #226 | Tragic 53.7% |
| Sudanese | 4.1 /100 | #227 | Tragic 53.6% |
| Alaska Natives | 3.9 /100 | #228 | Tragic 53.6% |
| Immigrants | Turkey | 3.8 /100 | #229 | Tragic 53.6% |
Demographics Similar to Immigrants from Yemen by 2 or more Vehicles in Household
In terms of 2 or more vehicles in household, the demographic groups most similar to Immigrants from Yemen are Immigrants from Senegal (43.0%, a difference of 0.41%), Inupiat (42.6%, a difference of 0.50%), Immigrants from West Indies (43.1%, a difference of 0.56%), Immigrants from Cabo Verde (43.3%, a difference of 1.1%), and Ecuadorian (42.0%, a difference of 2.1%).
| Demographics | Rating | Rank | 2 or more Vehicles in Household |
| Soviet Union | 0.0 /100 | #320 | Tragic 45.7% |
| Immigrants | Jamaica | 0.0 /100 | #321 | Tragic 44.5% |
| Senegalese | 0.0 /100 | #322 | Tragic 44.2% |
| Immigrants | Caribbean | 0.0 /100 | #323 | Tragic 44.2% |
| Immigrants | Cabo Verde | 0.0 /100 | #324 | Tragic 43.3% |
| Immigrants | West Indies | 0.0 /100 | #325 | Tragic 43.1% |
| Immigrants | Senegal | 0.0 /100 | #326 | Tragic 43.0% |
| Immigrants | Yemen | 0.0 /100 | #327 | Tragic 42.8% |
| Inupiat | 0.0 /100 | #328 | Tragic 42.6% |
| Ecuadorians | 0.0 /100 | #329 | Tragic 42.0% |
| Immigrants | Dominica | 0.0 /100 | #330 | Tragic 41.6% |
| West Indians | 0.0 /100 | #331 | Tragic 41.3% |
| Trinidadians and Tobagonians | 0.0 /100 | #332 | Tragic 40.9% |
| Immigrants | Ecuador | 0.0 /100 | #333 | Tragic 40.5% |
| Immigrants | Trinidad and Tobago | 0.0 /100 | #334 | Tragic 40.3% |