Kiowa vs Belizean 2 or more Vehicles in Household
COMPARE
Kiowa
Belizean
2 or more Vehicles in Household
2 or more Vehicles in Household Comparison
Kiowa
Belizeans
53.9%
2 OR MORE VEHICLES IN HOUSEHOLD
6.2/ 100
METRIC RATING
222nd/ 347
METRIC RANK
51.0%
2 OR MORE VEHICLES IN HOUSEHOLD
0.0/ 100
METRIC RATING
291st/ 347
METRIC RANK
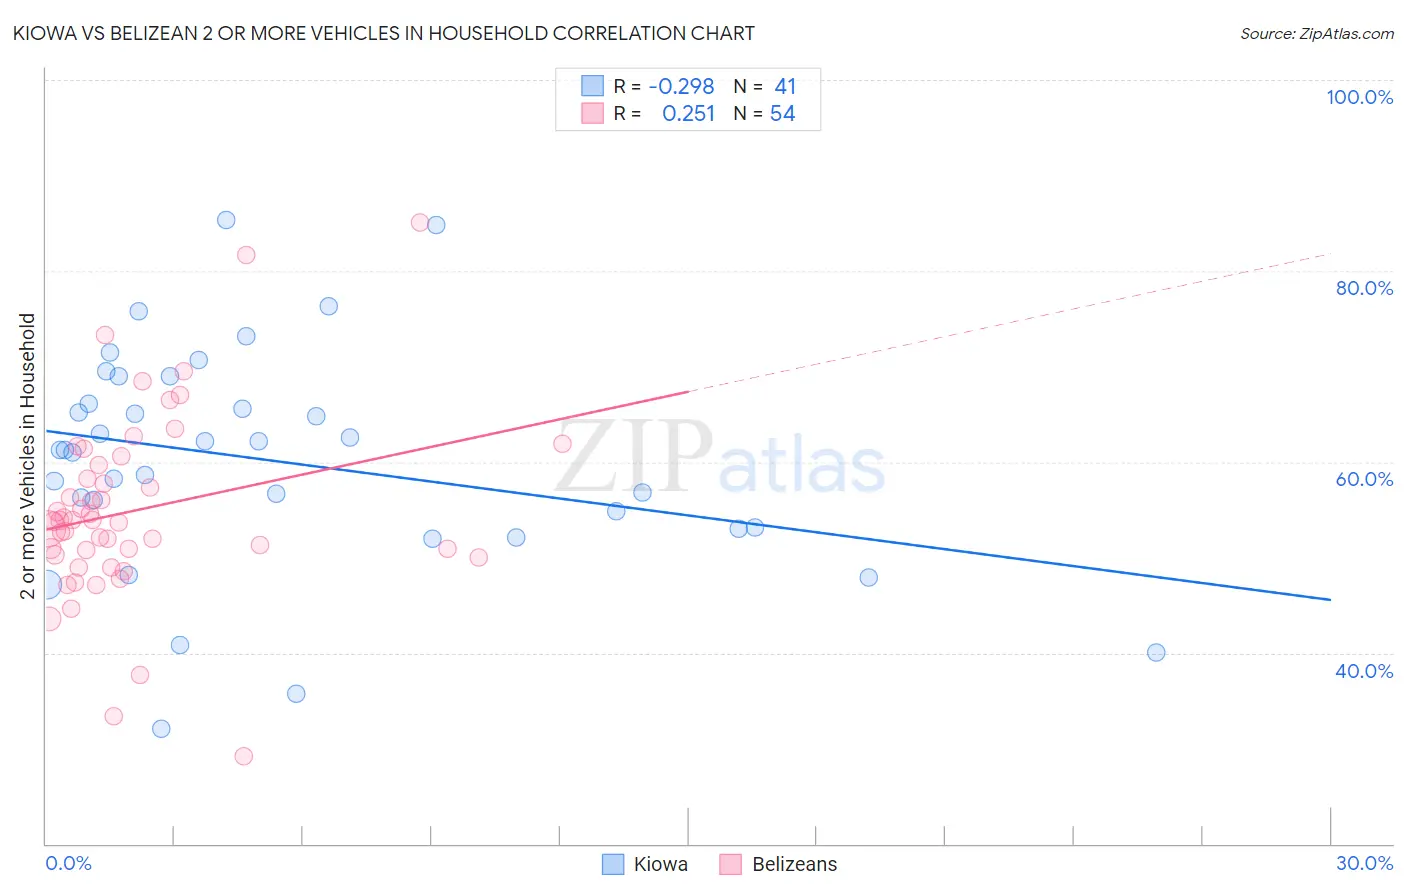
Kiowa vs Belizean 2 or more Vehicles in Household Correlation Chart
The statistical analysis conducted on geographies consisting of 56,099,396 people shows a weak negative correlation between the proportion of Kiowa and percentage of households with 2 or more vehicles available in the United States with a correlation coefficient (R) of -0.298 and weighted average of 53.9%. Similarly, the statistical analysis conducted on geographies consisting of 144,162,212 people shows a weak positive correlation between the proportion of Belizeans and percentage of households with 2 or more vehicles available in the United States with a correlation coefficient (R) of 0.251 and weighted average of 51.0%, a difference of 5.5%.
2 or more Vehicles in Household Correlation Summary
| Measurement | Kiowa | Belizean |
| Minimum | 32.0% | 29.2% |
| Maximum | 85.3% | 85.1% |
| Range | 53.2% | 55.9% |
| Mean | 60.1% | 54.9% |
| Median | 61.2% | 53.8% |
| Interquartile 25% (IQ1) | 53.1% | 50.2% |
| Interquartile 75% (IQ3) | 67.5% | 59.7% |
| Interquartile Range (IQR) | 14.5% | 9.5% |
| Standard Deviation (Sample) | 11.7% | 9.9% |
| Standard Deviation (Population) | 11.6% | 9.8% |
Similar Demographics by 2 or more Vehicles in Household
Demographics Similar to Kiowa by 2 or more Vehicles in Household
In terms of 2 or more vehicles in household, the demographic groups most similar to Kiowa are Immigrants from Singapore (53.9%, a difference of 0.010%), Taiwanese (53.9%, a difference of 0.030%), South American Indian (53.9%, a difference of 0.050%), Immigrants from Argentina (53.9%, a difference of 0.11%), and Immigrants from Bosnia and Herzegovina (53.8%, a difference of 0.13%).
| Demographics | Rating | Rank | 2 or more Vehicles in Household |
| Aleuts | 9.3 /100 | #215 | Tragic 54.1% |
| Immigrants | Western Asia | 9.3 /100 | #216 | Tragic 54.1% |
| Immigrants | Burma/Myanmar | 7.1 /100 | #217 | Tragic 53.9% |
| Immigrants | Argentina | 6.8 /100 | #218 | Tragic 53.9% |
| South American Indians | 6.5 /100 | #219 | Tragic 53.9% |
| Taiwanese | 6.3 /100 | #220 | Tragic 53.9% |
| Immigrants | Singapore | 6.3 /100 | #221 | Tragic 53.9% |
| Kiowa | 6.2 /100 | #222 | Tragic 53.9% |
| Immigrants | Bosnia and Herzegovina | 5.5 /100 | #223 | Tragic 53.8% |
| Brazilians | 5.3 /100 | #224 | Tragic 53.8% |
| Immigrants | Egypt | 5.2 /100 | #225 | Tragic 53.8% |
| Immigrants | Eastern Africa | 5.1 /100 | #226 | Tragic 53.7% |
| Sudanese | 4.1 /100 | #227 | Tragic 53.6% |
| Alaska Natives | 3.9 /100 | #228 | Tragic 53.6% |
| Immigrants | Turkey | 3.8 /100 | #229 | Tragic 53.6% |
Demographics Similar to Belizeans by 2 or more Vehicles in Household
In terms of 2 or more vehicles in household, the demographic groups most similar to Belizeans are Immigrants from Panama (51.1%, a difference of 0.030%), Somali (51.1%, a difference of 0.10%), Immigrants from Ukraine (50.9%, a difference of 0.33%), Black/African American (50.9%, a difference of 0.33%), and Okinawan (51.2%, a difference of 0.38%).
| Demographics | Rating | Rank | 2 or more Vehicles in Household |
| Immigrants | Zaire | 0.1 /100 | #284 | Tragic 51.5% |
| Immigrants | Uruguay | 0.1 /100 | #285 | Tragic 51.4% |
| Immigrants | Liberia | 0.1 /100 | #286 | Tragic 51.3% |
| Immigrants | Serbia | 0.1 /100 | #287 | Tragic 51.3% |
| Okinawans | 0.1 /100 | #288 | Tragic 51.2% |
| Somalis | 0.0 /100 | #289 | Tragic 51.1% |
| Immigrants | Panama | 0.0 /100 | #290 | Tragic 51.1% |
| Belizeans | 0.0 /100 | #291 | Tragic 51.0% |
| Immigrants | Ukraine | 0.0 /100 | #292 | Tragic 50.9% |
| Blacks/African Americans | 0.0 /100 | #293 | Tragic 50.9% |
| Bermudans | 0.0 /100 | #294 | Tragic 50.6% |
| Cypriots | 0.0 /100 | #295 | Tragic 50.6% |
| Immigrants | Somalia | 0.0 /100 | #296 | Tragic 50.5% |
| Immigrants | Spain | 0.0 /100 | #297 | Tragic 50.4% |
| Paraguayans | 0.0 /100 | #298 | Tragic 50.3% |