Immigrants vs Immigrants from Yemen 2 or more Vehicles in Household
COMPARE
Immigrants
Immigrants from Yemen
2 or more Vehicles in Household
2 or more Vehicles in Household Comparison
Immigrants
Immigrants from Yemen
54.7%
2 OR MORE VEHICLES IN HOUSEHOLD
25.0/ 100
METRIC RATING
191st/ 347
METRIC RANK
42.8%
2 OR MORE VEHICLES IN HOUSEHOLD
0.0/ 100
METRIC RATING
327th/ 347
METRIC RANK
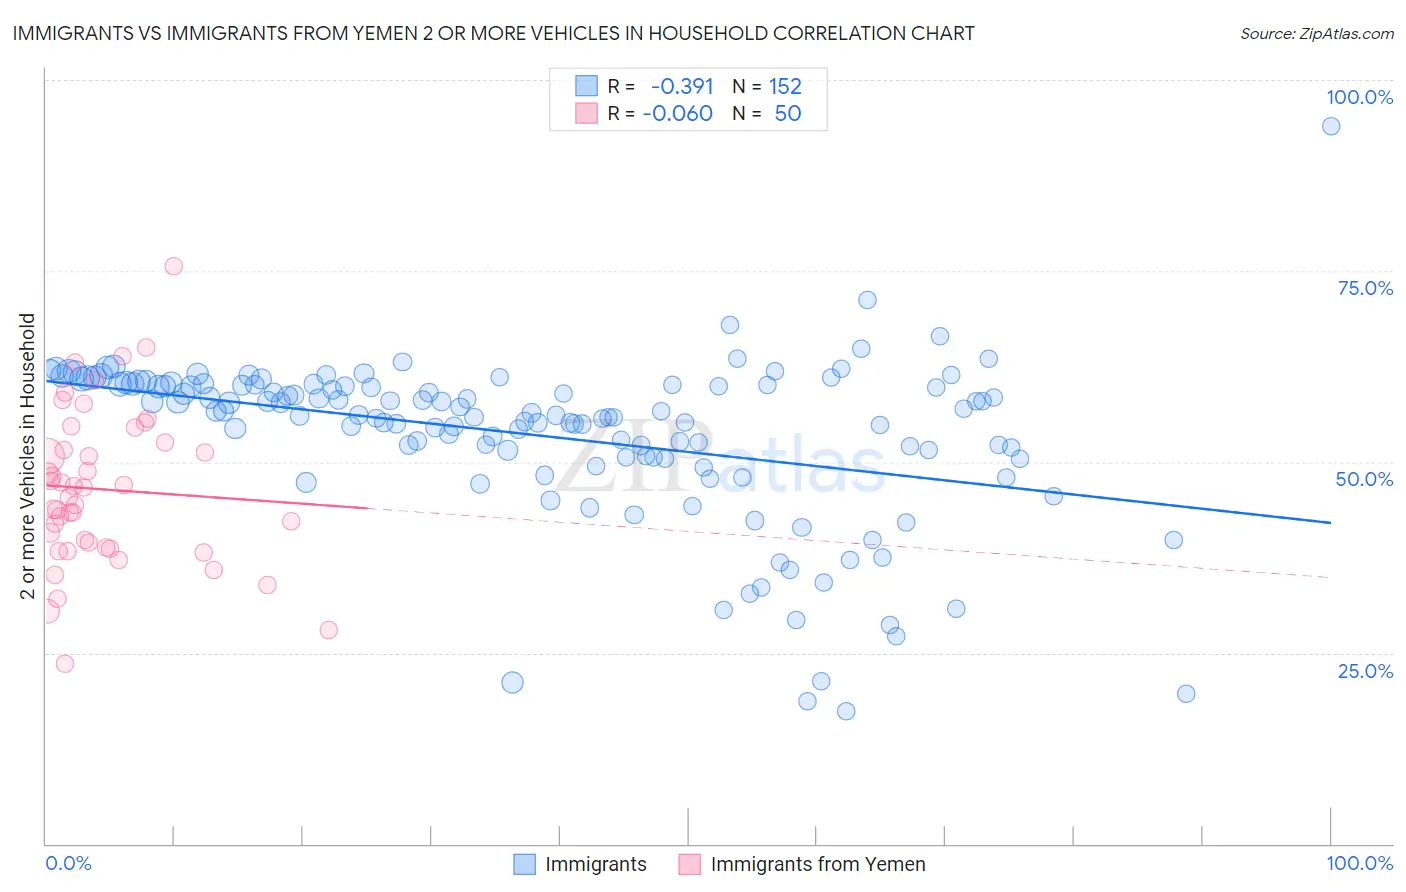
Immigrants vs Immigrants from Yemen 2 or more Vehicles in Household Correlation Chart
The statistical analysis conducted on geographies consisting of 577,129,923 people shows a mild negative correlation between the proportion of Immigrants and percentage of households with 2 or more vehicles available in the United States with a correlation coefficient (R) of -0.391 and weighted average of 54.7%. Similarly, the statistical analysis conducted on geographies consisting of 82,431,124 people shows a slight negative correlation between the proportion of Immigrants from Yemen and percentage of households with 2 or more vehicles available in the United States with a correlation coefficient (R) of -0.060 and weighted average of 42.8%, a difference of 27.8%.
2 or more Vehicles in Household Correlation Summary
| Measurement | Immigrants | Immigrants from Yemen |
| Minimum | 17.3% | 23.5% |
| Maximum | 94.0% | 75.5% |
| Range | 76.6% | 52.0% |
| Mean | 53.4% | 46.4% |
| Median | 56.3% | 46.0% |
| Interquartile 25% (IQ1) | 50.6% | 38.8% |
| Interquartile 75% (IQ3) | 60.1% | 52.6% |
| Interquartile Range (IQR) | 9.5% | 13.8% |
| Standard Deviation (Sample) | 10.9% | 10.3% |
| Standard Deviation (Population) | 10.9% | 10.2% |
Similar Demographics by 2 or more Vehicles in Household
Demographics Similar to Immigrants by 2 or more Vehicles in Household
In terms of 2 or more vehicles in household, the demographic groups most similar to Immigrants are Immigrants from Romania (54.7%, a difference of 0.060%), Russian (54.8%, a difference of 0.070%), Immigrants from Japan (54.7%, a difference of 0.090%), Central American (54.7%, a difference of 0.11%), and Eastern European (54.8%, a difference of 0.13%).
| Demographics | Rating | Rank | 2 or more Vehicles in Household |
| Apache | 36.7 /100 | #184 | Fair 55.1% |
| Arabs | 35.9 /100 | #185 | Fair 55.0% |
| Peruvians | 33.7 /100 | #186 | Fair 55.0% |
| Immigrants | Uganda | 33.4 /100 | #187 | Fair 55.0% |
| Marshallese | 30.5 /100 | #188 | Fair 54.9% |
| Eastern Europeans | 27.5 /100 | #189 | Fair 54.8% |
| Russians | 26.3 /100 | #190 | Fair 54.8% |
| Immigrants | Immigrants | 25.0 /100 | #191 | Fair 54.7% |
| Immigrants | Romania | 23.8 /100 | #192 | Fair 54.7% |
| Immigrants | Japan | 23.4 /100 | #193 | Fair 54.7% |
| Central Americans | 23.0 /100 | #194 | Fair 54.7% |
| Iroquois | 22.6 /100 | #195 | Fair 54.7% |
| Immigrants | Poland | 19.3 /100 | #196 | Poor 54.6% |
| Argentineans | 17.5 /100 | #197 | Poor 54.5% |
| Carpatho Rusyns | 16.2 /100 | #198 | Poor 54.4% |
Demographics Similar to Immigrants from Yemen by 2 or more Vehicles in Household
In terms of 2 or more vehicles in household, the demographic groups most similar to Immigrants from Yemen are Immigrants from Senegal (43.0%, a difference of 0.41%), Inupiat (42.6%, a difference of 0.50%), Immigrants from West Indies (43.1%, a difference of 0.56%), Immigrants from Cabo Verde (43.3%, a difference of 1.1%), and Ecuadorian (42.0%, a difference of 2.1%).
| Demographics | Rating | Rank | 2 or more Vehicles in Household |
| Soviet Union | 0.0 /100 | #320 | Tragic 45.7% |
| Immigrants | Jamaica | 0.0 /100 | #321 | Tragic 44.5% |
| Senegalese | 0.0 /100 | #322 | Tragic 44.2% |
| Immigrants | Caribbean | 0.0 /100 | #323 | Tragic 44.2% |
| Immigrants | Cabo Verde | 0.0 /100 | #324 | Tragic 43.3% |
| Immigrants | West Indies | 0.0 /100 | #325 | Tragic 43.1% |
| Immigrants | Senegal | 0.0 /100 | #326 | Tragic 43.0% |
| Immigrants | Yemen | 0.0 /100 | #327 | Tragic 42.8% |
| Inupiat | 0.0 /100 | #328 | Tragic 42.6% |
| Ecuadorians | 0.0 /100 | #329 | Tragic 42.0% |
| Immigrants | Dominica | 0.0 /100 | #330 | Tragic 41.6% |
| West Indians | 0.0 /100 | #331 | Tragic 41.3% |
| Trinidadians and Tobagonians | 0.0 /100 | #332 | Tragic 40.9% |
| Immigrants | Ecuador | 0.0 /100 | #333 | Tragic 40.5% |
| Immigrants | Trinidad and Tobago | 0.0 /100 | #334 | Tragic 40.3% |