Kiowa vs Immigrants from Yemen Unemployment Among Ages 30 to 34 years
COMPARE
Kiowa
Immigrants from Yemen
Unemployment Among Ages 30 to 34 years
Unemployment Among Ages 30 to 34 years Comparison
Kiowa
Immigrants from Yemen
6.7%
UNEMPLOYMENT AMONG AGES 30 TO 34 YEARS
0.0/ 100
METRIC RATING
304th/ 347
METRIC RANK
7.3%
UNEMPLOYMENT AMONG AGES 30 TO 34 YEARS
0.0/ 100
METRIC RATING
323rd/ 347
METRIC RANK
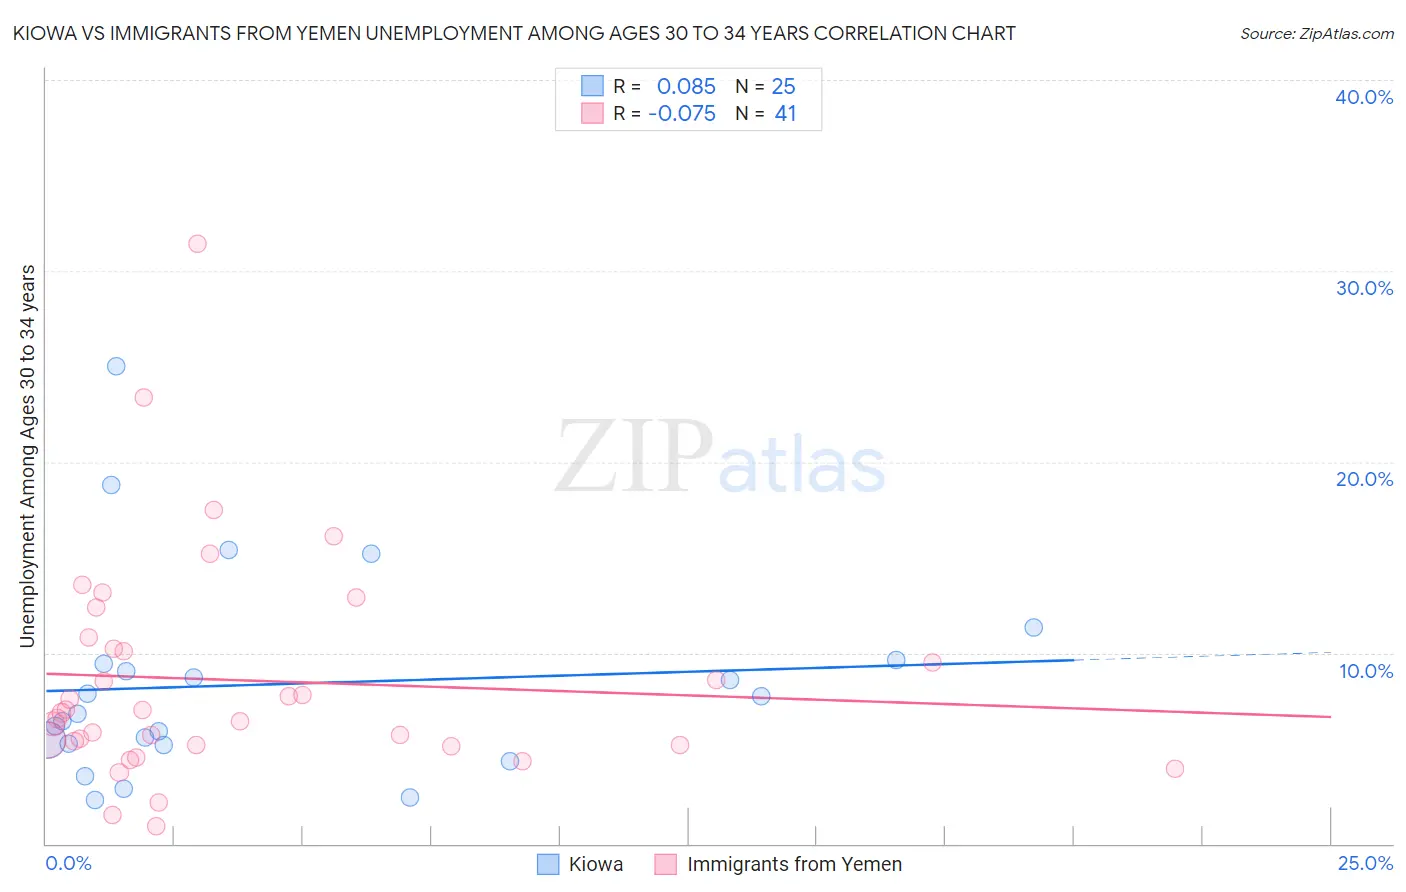
Kiowa vs Immigrants from Yemen Unemployment Among Ages 30 to 34 years Correlation Chart
The statistical analysis conducted on geographies consisting of 55,274,953 people shows a slight positive correlation between the proportion of Kiowa and unemployment rate among population between the ages 30 and 34 in the United States with a correlation coefficient (R) of 0.085 and weighted average of 6.7%. Similarly, the statistical analysis conducted on geographies consisting of 81,630,994 people shows a slight negative correlation between the proportion of Immigrants from Yemen and unemployment rate among population between the ages 30 and 34 in the United States with a correlation coefficient (R) of -0.075 and weighted average of 7.3%, a difference of 8.7%.
Unemployment Among Ages 30 to 34 years Correlation Summary
| Measurement | Kiowa | Immigrants from Yemen |
| Minimum | 2.3% | 0.90% |
| Maximum | 25.0% | 31.4% |
| Range | 22.7% | 30.5% |
| Mean | 8.3% | 8.6% |
| Median | 6.8% | 6.8% |
| Interquartile 25% (IQ1) | 5.2% | 5.2% |
| Interquartile 75% (IQ3) | 9.5% | 10.5% |
| Interquartile Range (IQR) | 4.3% | 5.3% |
| Standard Deviation (Sample) | 5.4% | 5.9% |
| Standard Deviation (Population) | 5.3% | 5.8% |
Demographics Similar to Kiowa and Immigrants from Yemen by Unemployment Among Ages 30 to 34 years
In terms of unemployment among ages 30 to 34 years, the demographic groups most similar to Kiowa are Paiute (6.7%, a difference of 0.040%), Cajun (6.7%, a difference of 0.42%), Immigrants from Armenia (6.8%, a difference of 2.3%), Immigrants from Belize (6.9%, a difference of 2.5%), and Immigrants from the Azores (6.9%, a difference of 2.9%). Similarly, the demographic groups most similar to Immigrants from Yemen are Marshallese (7.2%, a difference of 0.46%), Immigrants from Guyana (7.2%, a difference of 0.96%), Cape Verdean (7.2%, a difference of 1.3%), Guyanese (7.2%, a difference of 1.3%), and Black/African American (7.2%, a difference of 1.3%).
| Demographics | Rating | Rank | Unemployment Among Ages 30 to 34 years |
| Cajuns | 0.0 /100 | #303 | Tragic 6.7% |
| Kiowa | 0.0 /100 | #304 | Tragic 6.7% |
| Paiute | 0.0 /100 | #305 | Tragic 6.7% |
| Immigrants | Armenia | 0.0 /100 | #306 | Tragic 6.8% |
| Immigrants | Belize | 0.0 /100 | #307 | Tragic 6.9% |
| Immigrants | Azores | 0.0 /100 | #308 | Tragic 6.9% |
| Immigrants | Grenada | 0.0 /100 | #309 | Tragic 6.9% |
| Immigrants | St. Vincent and the Grenadines | 0.0 /100 | #310 | Tragic 7.0% |
| Alaskan Athabascans | 0.0 /100 | #311 | Tragic 7.0% |
| British West Indians | 0.0 /100 | #312 | Tragic 7.0% |
| Ute | 0.0 /100 | #313 | Tragic 7.0% |
| Lumbee | 0.0 /100 | #314 | Tragic 7.1% |
| Aleuts | 0.0 /100 | #315 | Tragic 7.1% |
| Houma | 0.0 /100 | #316 | Tragic 7.2% |
| Immigrants | Cabo Verde | 0.0 /100 | #317 | Tragic 7.2% |
| Blacks/African Americans | 0.0 /100 | #318 | Tragic 7.2% |
| Guyanese | 0.0 /100 | #319 | Tragic 7.2% |
| Cape Verdeans | 0.0 /100 | #320 | Tragic 7.2% |
| Immigrants | Guyana | 0.0 /100 | #321 | Tragic 7.2% |
| Marshallese | 0.0 /100 | #322 | Tragic 7.2% |
| Immigrants | Yemen | 0.0 /100 | #323 | Tragic 7.3% |