Immigrants from Grenada vs Immigrants from Yemen 2 or more Vehicles in Household
COMPARE
Immigrants from Grenada
Immigrants from Yemen
2 or more Vehicles in Household
2 or more Vehicles in Household Comparison
Immigrants from Grenada
Immigrants from Yemen
28.7%
2 OR MORE VEHICLES IN HOUSEHOLD
0.0/ 100
METRIC RATING
347th/ 347
METRIC RANK
42.8%
2 OR MORE VEHICLES IN HOUSEHOLD
0.0/ 100
METRIC RATING
327th/ 347
METRIC RANK
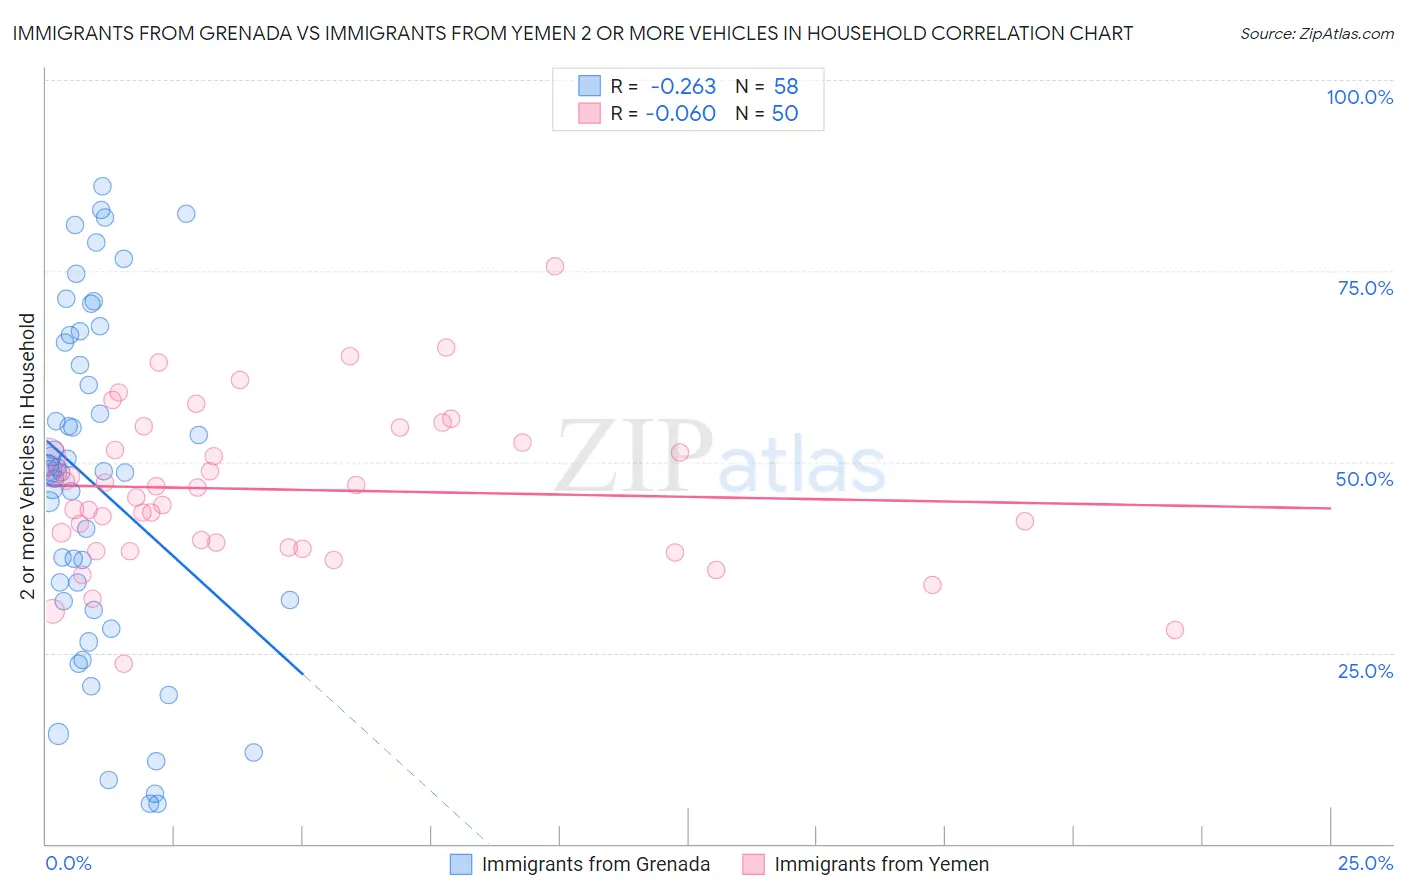
Immigrants from Grenada vs Immigrants from Yemen 2 or more Vehicles in Household Correlation Chart
The statistical analysis conducted on geographies consisting of 67,200,374 people shows a weak negative correlation between the proportion of Immigrants from Grenada and percentage of households with 2 or more vehicles available in the United States with a correlation coefficient (R) of -0.263 and weighted average of 28.7%. Similarly, the statistical analysis conducted on geographies consisting of 82,431,124 people shows a slight negative correlation between the proportion of Immigrants from Yemen and percentage of households with 2 or more vehicles available in the United States with a correlation coefficient (R) of -0.060 and weighted average of 42.8%, a difference of 49.5%.
2 or more Vehicles in Household Correlation Summary
| Measurement | Immigrants from Grenada | Immigrants from Yemen |
| Minimum | 5.2% | 23.5% |
| Maximum | 86.2% | 75.5% |
| Range | 81.0% | 52.0% |
| Mean | 46.9% | 46.4% |
| Median | 48.8% | 46.0% |
| Interquartile 25% (IQ1) | 31.8% | 38.8% |
| Interquartile 75% (IQ3) | 65.6% | 52.6% |
| Interquartile Range (IQR) | 33.8% | 13.8% |
| Standard Deviation (Sample) | 22.2% | 10.3% |
| Standard Deviation (Population) | 22.0% | 10.2% |
Demographics Similar to Immigrants from Grenada and Immigrants from Yemen by 2 or more Vehicles in Household
In terms of 2 or more vehicles in household, the demographic groups most similar to Immigrants from Grenada are Immigrants from St. Vincent and the Grenadines (31.0%, a difference of 8.1%), Immigrants from Dominican Republic (33.2%, a difference of 16.0%), Yup'ik (34.9%, a difference of 21.9%), Immigrants from Guyana (35.0%, a difference of 22.1%), and Dominican (35.3%, a difference of 23.2%). Similarly, the demographic groups most similar to Immigrants from Yemen are Inupiat (42.6%, a difference of 0.50%), Ecuadorian (42.0%, a difference of 2.1%), Immigrants from Dominica (41.6%, a difference of 2.9%), West Indian (41.3%, a difference of 3.8%), and Trinidadian and Tobagonian (40.9%, a difference of 4.8%).
| Demographics | Rating | Rank | 2 or more Vehicles in Household |
| Immigrants | Yemen | 0.0 /100 | #327 | Tragic 42.8% |
| Inupiat | 0.0 /100 | #328 | Tragic 42.6% |
| Ecuadorians | 0.0 /100 | #329 | Tragic 42.0% |
| Immigrants | Dominica | 0.0 /100 | #330 | Tragic 41.6% |
| West Indians | 0.0 /100 | #331 | Tragic 41.3% |
| Trinidadians and Tobagonians | 0.0 /100 | #332 | Tragic 40.9% |
| Immigrants | Ecuador | 0.0 /100 | #333 | Tragic 40.5% |
| Immigrants | Trinidad and Tobago | 0.0 /100 | #334 | Tragic 40.3% |
| Immigrants | Bangladesh | 0.0 /100 | #335 | Tragic 38.8% |
| Vietnamese | 0.0 /100 | #336 | Tragic 38.5% |
| Barbadians | 0.0 /100 | #337 | Tragic 38.3% |
| Immigrants | Uzbekistan | 0.0 /100 | #338 | Tragic 37.9% |
| Immigrants | Barbados | 0.0 /100 | #339 | Tragic 35.8% |
| British West Indians | 0.0 /100 | #340 | Tragic 35.4% |
| Guyanese | 0.0 /100 | #341 | Tragic 35.4% |
| Dominicans | 0.0 /100 | #342 | Tragic 35.3% |
| Immigrants | Guyana | 0.0 /100 | #343 | Tragic 35.0% |
| Yup'ik | 0.0 /100 | #344 | Tragic 34.9% |
| Immigrants | Dominican Republic | 0.0 /100 | #345 | Tragic 33.2% |
| Immigrants | St. Vincent and the Grenadines | 0.0 /100 | #346 | Tragic 31.0% |
| Immigrants | Grenada | 0.0 /100 | #347 | Tragic 28.7% |