Kiowa vs Immigrants from Bolivia 2 or more Vehicles in Household
COMPARE
Kiowa
Immigrants from Bolivia
2 or more Vehicles in Household
2 or more Vehicles in Household Comparison
Kiowa
Immigrants from Bolivia
53.9%
2 OR MORE VEHICLES IN HOUSEHOLD
6.2/ 100
METRIC RATING
222nd/ 347
METRIC RANK
57.6%
2 OR MORE VEHICLES IN HOUSEHOLD
98.2/ 100
METRIC RATING
102nd/ 347
METRIC RANK
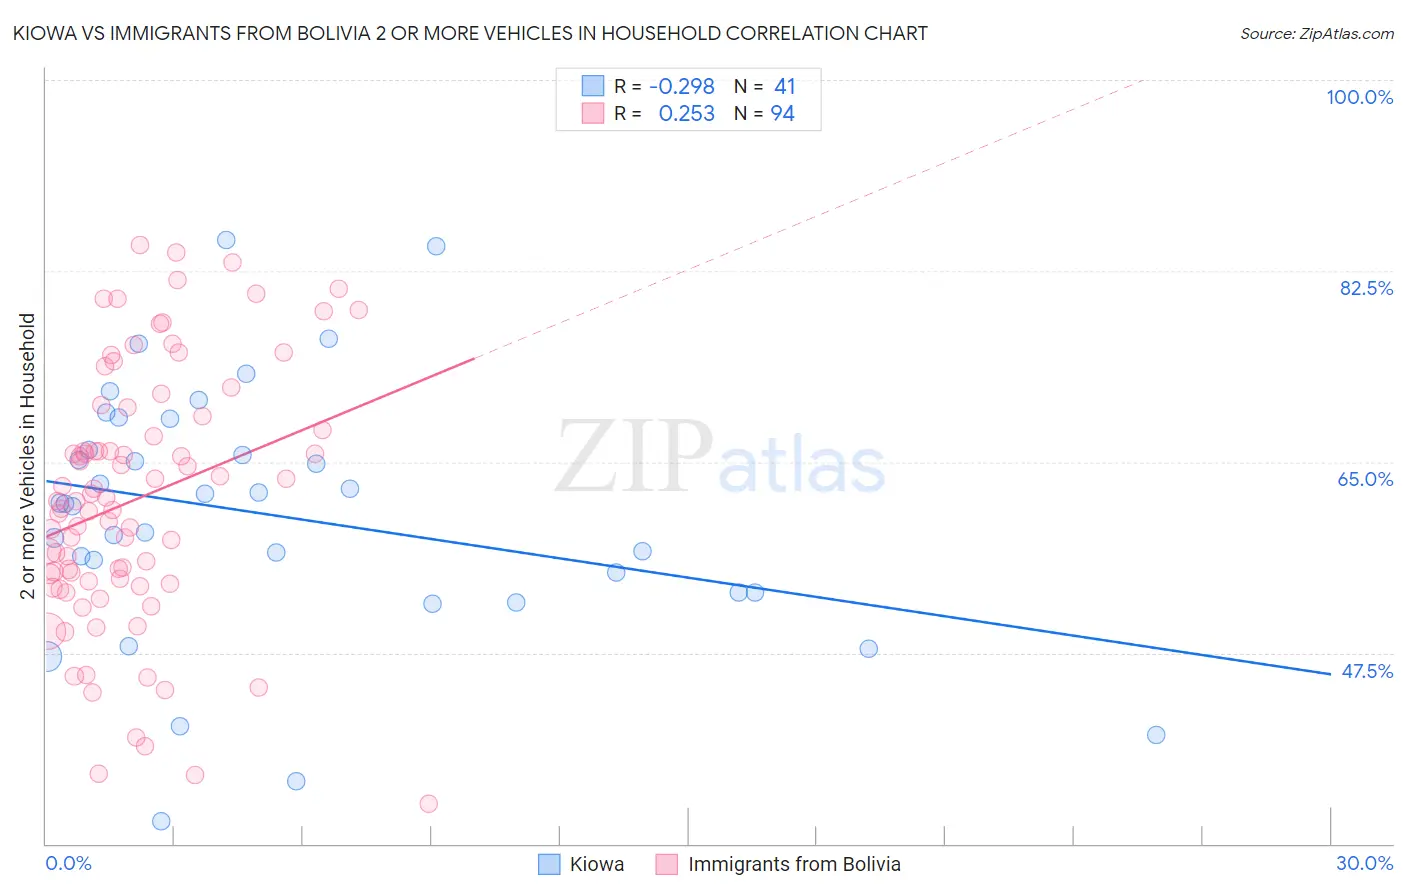
Kiowa vs Immigrants from Bolivia 2 or more Vehicles in Household Correlation Chart
The statistical analysis conducted on geographies consisting of 56,099,396 people shows a weak negative correlation between the proportion of Kiowa and percentage of households with 2 or more vehicles available in the United States with a correlation coefficient (R) of -0.298 and weighted average of 53.9%. Similarly, the statistical analysis conducted on geographies consisting of 158,713,360 people shows a weak positive correlation between the proportion of Immigrants from Bolivia and percentage of households with 2 or more vehicles available in the United States with a correlation coefficient (R) of 0.253 and weighted average of 57.6%, a difference of 6.9%.
2 or more Vehicles in Household Correlation Summary
| Measurement | Kiowa | Immigrants from Bolivia |
| Minimum | 32.0% | 33.7% |
| Maximum | 85.3% | 84.8% |
| Range | 53.2% | 51.2% |
| Mean | 60.1% | 61.6% |
| Median | 61.2% | 61.4% |
| Interquartile 25% (IQ1) | 53.1% | 54.1% |
| Interquartile 75% (IQ3) | 67.5% | 69.1% |
| Interquartile Range (IQR) | 14.5% | 15.1% |
| Standard Deviation (Sample) | 11.7% | 11.8% |
| Standard Deviation (Population) | 11.6% | 11.7% |
Similar Demographics by 2 or more Vehicles in Household
Demographics Similar to Kiowa by 2 or more Vehicles in Household
In terms of 2 or more vehicles in household, the demographic groups most similar to Kiowa are Immigrants from Singapore (53.9%, a difference of 0.010%), Taiwanese (53.9%, a difference of 0.030%), South American Indian (53.9%, a difference of 0.050%), Immigrants from Argentina (53.9%, a difference of 0.11%), and Immigrants from Bosnia and Herzegovina (53.8%, a difference of 0.13%).
| Demographics | Rating | Rank | 2 or more Vehicles in Household |
| Aleuts | 9.3 /100 | #215 | Tragic 54.1% |
| Immigrants | Western Asia | 9.3 /100 | #216 | Tragic 54.1% |
| Immigrants | Burma/Myanmar | 7.1 /100 | #217 | Tragic 53.9% |
| Immigrants | Argentina | 6.8 /100 | #218 | Tragic 53.9% |
| South American Indians | 6.5 /100 | #219 | Tragic 53.9% |
| Taiwanese | 6.3 /100 | #220 | Tragic 53.9% |
| Immigrants | Singapore | 6.3 /100 | #221 | Tragic 53.9% |
| Kiowa | 6.2 /100 | #222 | Tragic 53.9% |
| Immigrants | Bosnia and Herzegovina | 5.5 /100 | #223 | Tragic 53.8% |
| Brazilians | 5.3 /100 | #224 | Tragic 53.8% |
| Immigrants | Egypt | 5.2 /100 | #225 | Tragic 53.8% |
| Immigrants | Eastern Africa | 5.1 /100 | #226 | Tragic 53.7% |
| Sudanese | 4.1 /100 | #227 | Tragic 53.6% |
| Alaska Natives | 3.9 /100 | #228 | Tragic 53.6% |
| Immigrants | Turkey | 3.8 /100 | #229 | Tragic 53.6% |
Demographics Similar to Immigrants from Bolivia by 2 or more Vehicles in Household
In terms of 2 or more vehicles in household, the demographic groups most similar to Immigrants from Bolivia are Jordanian (57.6%, a difference of 0.0%), Immigrants from Indonesia (57.6%, a difference of 0.0%), Immigrants from Korea (57.6%, a difference of 0.010%), Immigrants from Oceania (57.5%, a difference of 0.020%), and Immigrants from Netherlands (57.5%, a difference of 0.040%).
| Demographics | Rating | Rank | 2 or more Vehicles in Household |
| Hmong | 98.9 /100 | #95 | Exceptional 57.8% |
| Burmese | 98.8 /100 | #96 | Exceptional 57.8% |
| Slavs | 98.8 /100 | #97 | Exceptional 57.8% |
| Palestinians | 98.6 /100 | #98 | Exceptional 57.7% |
| Cajuns | 98.5 /100 | #99 | Exceptional 57.7% |
| Fijians | 98.4 /100 | #100 | Exceptional 57.6% |
| Lebanese | 98.3 /100 | #101 | Exceptional 57.6% |
| Immigrants | Bolivia | 98.2 /100 | #102 | Exceptional 57.6% |
| Jordanians | 98.2 /100 | #103 | Exceptional 57.6% |
| Immigrants | Indonesia | 98.2 /100 | #104 | Exceptional 57.6% |
| Immigrants | Korea | 98.2 /100 | #105 | Exceptional 57.6% |
| Immigrants | Oceania | 98.2 /100 | #106 | Exceptional 57.5% |
| Immigrants | Netherlands | 98.2 /100 | #107 | Exceptional 57.5% |
| Immigrants | Canada | 98.1 /100 | #108 | Exceptional 57.5% |
| Immigrants | North America | 98.1 /100 | #109 | Exceptional 57.5% |