Welsh vs Immigrants from Yemen 2 or more Vehicles in Household
COMPARE
Welsh
Immigrants from Yemen
2 or more Vehicles in Household
2 or more Vehicles in Household Comparison
Welsh
Immigrants from Yemen
60.8%
2 OR MORE VEHICLES IN HOUSEHOLD
100.0/ 100
METRIC RATING
26th/ 347
METRIC RANK
42.8%
2 OR MORE VEHICLES IN HOUSEHOLD
0.0/ 100
METRIC RATING
327th/ 347
METRIC RANK
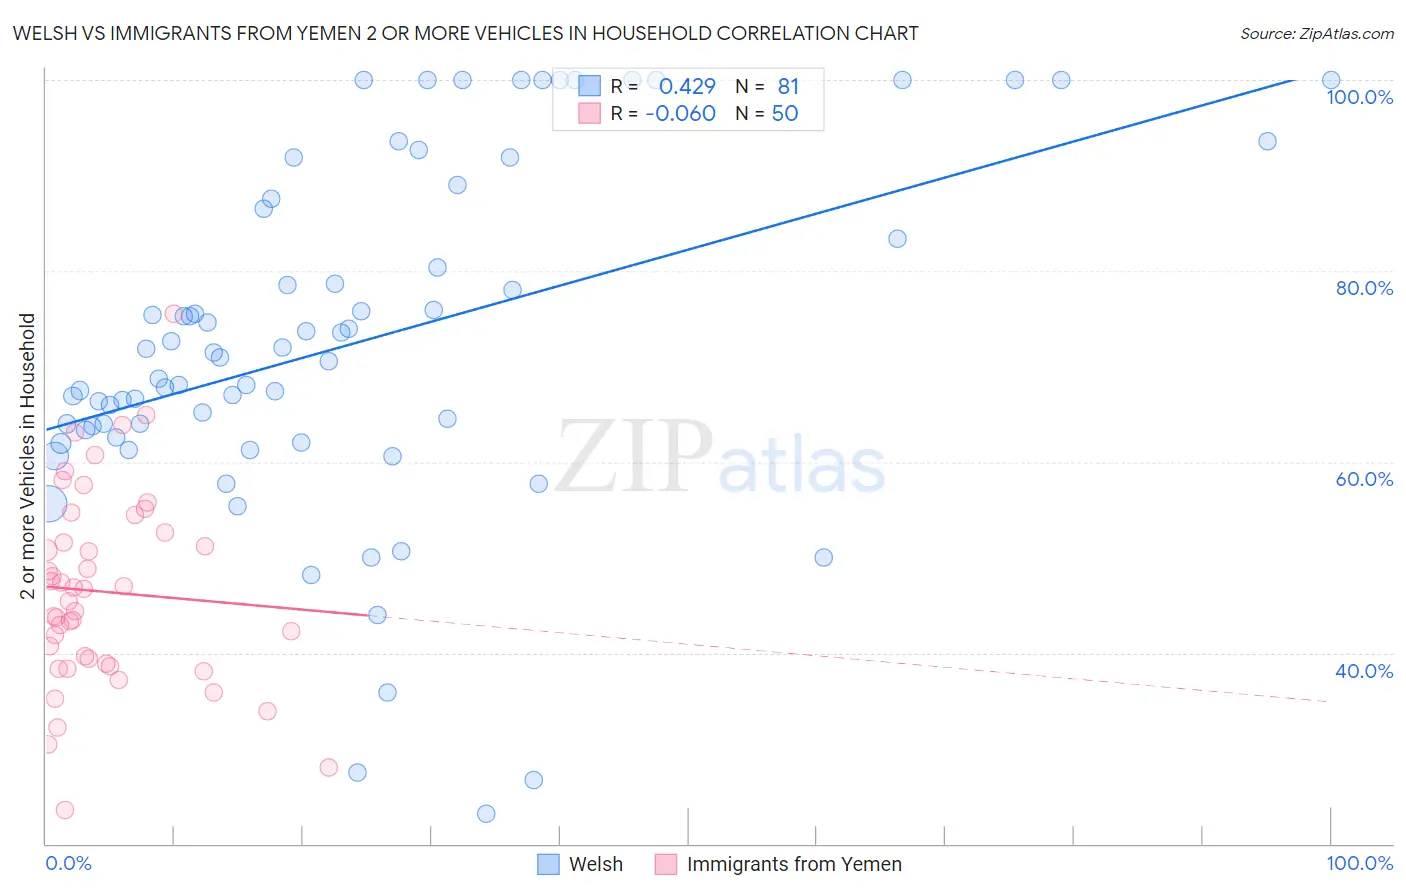
Welsh vs Immigrants from Yemen 2 or more Vehicles in Household Correlation Chart
The statistical analysis conducted on geographies consisting of 528,240,215 people shows a moderate positive correlation between the proportion of Welsh and percentage of households with 2 or more vehicles available in the United States with a correlation coefficient (R) of 0.429 and weighted average of 60.8%. Similarly, the statistical analysis conducted on geographies consisting of 82,431,124 people shows a slight negative correlation between the proportion of Immigrants from Yemen and percentage of households with 2 or more vehicles available in the United States with a correlation coefficient (R) of -0.060 and weighted average of 42.8%, a difference of 41.9%.
2 or more Vehicles in Household Correlation Summary
| Measurement | Welsh | Immigrants from Yemen |
| Minimum | 23.1% | 23.5% |
| Maximum | 100.0% | 75.5% |
| Range | 76.9% | 52.0% |
| Mean | 72.5% | 46.4% |
| Median | 70.9% | 46.0% |
| Interquartile 25% (IQ1) | 62.9% | 38.8% |
| Interquartile 75% (IQ3) | 87.0% | 52.6% |
| Interquartile Range (IQR) | 24.1% | 13.8% |
| Standard Deviation (Sample) | 18.2% | 10.3% |
| Standard Deviation (Population) | 18.1% | 10.2% |
Similar Demographics by 2 or more Vehicles in Household
Demographics Similar to Welsh by 2 or more Vehicles in Household
In terms of 2 or more vehicles in household, the demographic groups most similar to Welsh are White/Caucasian (60.8%, a difference of 0.050%), Immigrants from Vietnam (60.9%, a difference of 0.20%), Scotch-Irish (60.9%, a difference of 0.24%), Swiss (61.0%, a difference of 0.28%), and Korean (61.0%, a difference of 0.31%).
| Demographics | Rating | Rank | 2 or more Vehicles in Household |
| Scottish | 100.0 /100 | #19 | Exceptional 61.2% |
| Sri Lankans | 100.0 /100 | #20 | Exceptional 61.0% |
| Koreans | 100.0 /100 | #21 | Exceptional 61.0% |
| Swiss | 100.0 /100 | #22 | Exceptional 61.0% |
| Scotch-Irish | 100.0 /100 | #23 | Exceptional 60.9% |
| Immigrants | Vietnam | 100.0 /100 | #24 | Exceptional 60.9% |
| Whites/Caucasians | 100.0 /100 | #25 | Exceptional 60.8% |
| Welsh | 100.0 /100 | #26 | Exceptional 60.8% |
| Assyrians/Chaldeans/Syriacs | 100.0 /100 | #27 | Exceptional 60.5% |
| Guamanians/Chamorros | 100.0 /100 | #28 | Exceptional 60.5% |
| Hawaiians | 100.0 /100 | #29 | Exceptional 60.4% |
| Finns | 100.0 /100 | #30 | Exceptional 60.3% |
| Spanish American Indians | 100.0 /100 | #31 | Exceptional 60.3% |
| Arapaho | 100.0 /100 | #32 | Exceptional 60.2% |
| Immigrants | Mexico | 100.0 /100 | #33 | Exceptional 60.2% |
Demographics Similar to Immigrants from Yemen by 2 or more Vehicles in Household
In terms of 2 or more vehicles in household, the demographic groups most similar to Immigrants from Yemen are Immigrants from Senegal (43.0%, a difference of 0.41%), Inupiat (42.6%, a difference of 0.50%), Immigrants from West Indies (43.1%, a difference of 0.56%), Immigrants from Cabo Verde (43.3%, a difference of 1.1%), and Ecuadorian (42.0%, a difference of 2.1%).
| Demographics | Rating | Rank | 2 or more Vehicles in Household |
| Soviet Union | 0.0 /100 | #320 | Tragic 45.7% |
| Immigrants | Jamaica | 0.0 /100 | #321 | Tragic 44.5% |
| Senegalese | 0.0 /100 | #322 | Tragic 44.2% |
| Immigrants | Caribbean | 0.0 /100 | #323 | Tragic 44.2% |
| Immigrants | Cabo Verde | 0.0 /100 | #324 | Tragic 43.3% |
| Immigrants | West Indies | 0.0 /100 | #325 | Tragic 43.1% |
| Immigrants | Senegal | 0.0 /100 | #326 | Tragic 43.0% |
| Immigrants | Yemen | 0.0 /100 | #327 | Tragic 42.8% |
| Inupiat | 0.0 /100 | #328 | Tragic 42.6% |
| Ecuadorians | 0.0 /100 | #329 | Tragic 42.0% |
| Immigrants | Dominica | 0.0 /100 | #330 | Tragic 41.6% |
| West Indians | 0.0 /100 | #331 | Tragic 41.3% |
| Trinidadians and Tobagonians | 0.0 /100 | #332 | Tragic 40.9% |
| Immigrants | Ecuador | 0.0 /100 | #333 | Tragic 40.5% |
| Immigrants | Trinidad and Tobago | 0.0 /100 | #334 | Tragic 40.3% |