Iroquois vs Dutch No Vehicles in Household
COMPARE
Iroquois
Dutch
No Vehicles in Household
No Vehicles in Household Comparison
Iroquois
Dutch
10.9%
NO VEHICLES IN HOUSEHOLD
17.6/ 100
METRIC RATING
203rd/ 347
METRIC RANK
6.8%
NO VEHICLES IN HOUSEHOLD
100.0/ 100
METRIC RATING
10th/ 347
METRIC RANK
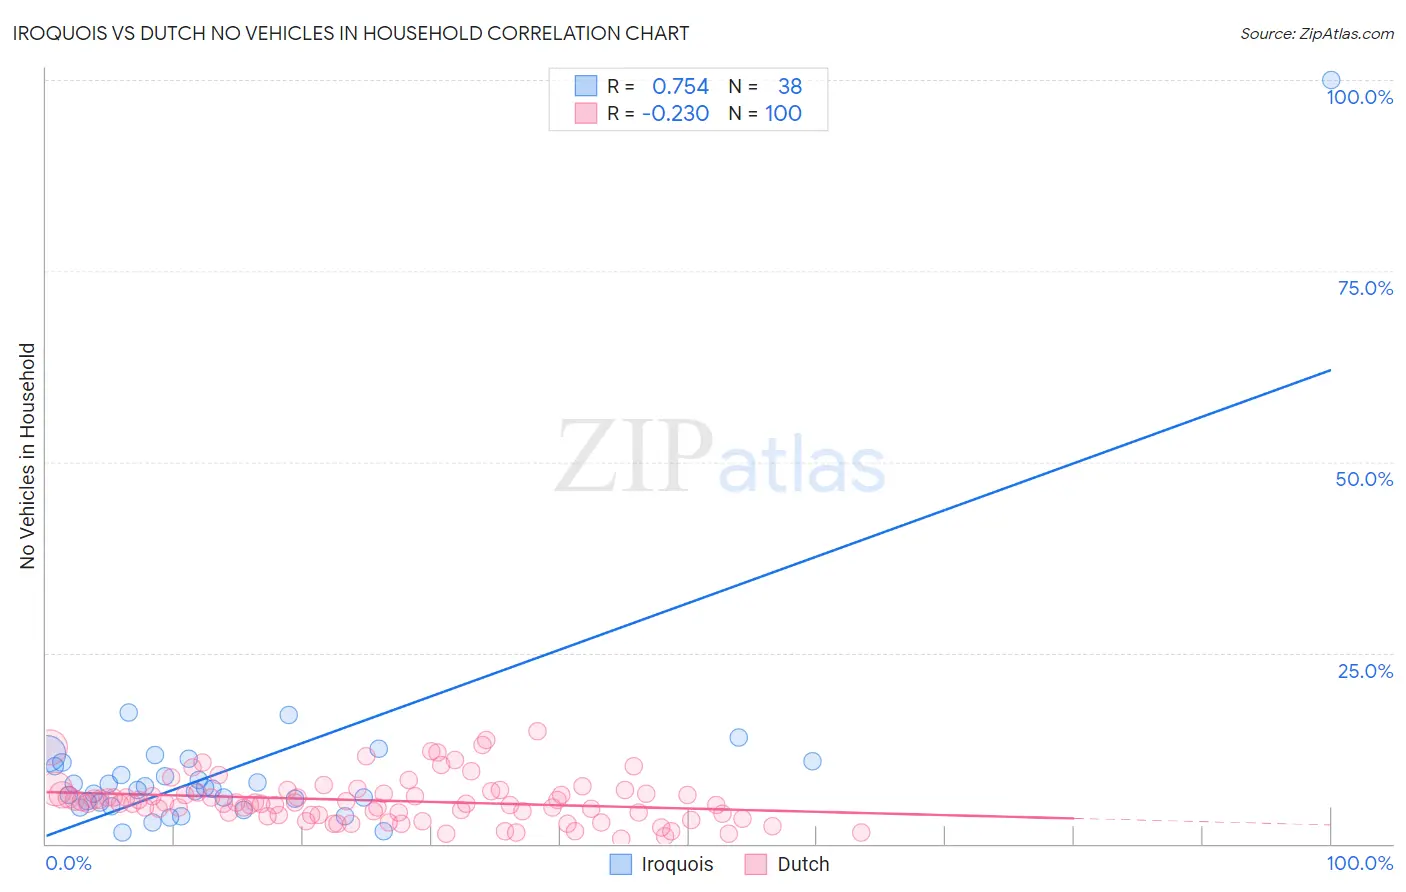
Iroquois vs Dutch No Vehicles in Household Correlation Chart
The statistical analysis conducted on geographies consisting of 206,994,531 people shows a strong positive correlation between the proportion of Iroquois and percentage of households with no vehicle available in the United States with a correlation coefficient (R) of 0.754 and weighted average of 10.9%. Similarly, the statistical analysis conducted on geographies consisting of 549,648,147 people shows a weak negative correlation between the proportion of Dutch and percentage of households with no vehicle available in the United States with a correlation coefficient (R) of -0.230 and weighted average of 6.8%, a difference of 60.0%.
No Vehicles in Household Correlation Summary
| Measurement | Iroquois | Dutch |
| Minimum | 1.5% | 0.69% |
| Maximum | 100.0% | 14.7% |
| Range | 98.5% | 14.0% |
| Mean | 10.1% | 5.7% |
| Median | 7.3% | 5.3% |
| Interquartile 25% (IQ1) | 5.5% | 3.8% |
| Interquartile 75% (IQ3) | 10.7% | 6.6% |
| Interquartile Range (IQR) | 5.2% | 2.9% |
| Standard Deviation (Sample) | 15.4% | 2.9% |
| Standard Deviation (Population) | 15.2% | 2.9% |
Similar Demographics by No Vehicles in Household
Demographics Similar to Iroquois by No Vehicles in Household
In terms of no vehicles in household, the demographic groups most similar to Iroquois are Romanian (10.9%, a difference of 0.070%), Immigrants from Western Europe (10.9%, a difference of 0.34%), Guatemalan (11.0%, a difference of 0.34%), Immigrants from Chile (11.0%, a difference of 0.38%), and Somali (11.0%, a difference of 0.39%).
| Demographics | Rating | Rank | No Vehicles in Household |
| Central Americans | 24.3 /100 | #196 | Fair 10.8% |
| Shoshone | 24.1 /100 | #197 | Fair 10.8% |
| Immigrants | Sweden | 22.9 /100 | #198 | Fair 10.8% |
| Immigrants | Asia | 21.3 /100 | #199 | Fair 10.9% |
| Cambodians | 19.6 /100 | #200 | Poor 10.9% |
| Immigrants | Western Europe | 19.1 /100 | #201 | Poor 10.9% |
| Romanians | 17.9 /100 | #202 | Poor 10.9% |
| Iroquois | 17.6 /100 | #203 | Poor 10.9% |
| Guatemalans | 16.1 /100 | #204 | Poor 11.0% |
| Immigrants | Chile | 15.9 /100 | #205 | Poor 11.0% |
| Somalis | 15.9 /100 | #206 | Poor 11.0% |
| Sierra Leoneans | 15.7 /100 | #207 | Poor 11.0% |
| Immigrants | Italy | 15.6 /100 | #208 | Poor 11.0% |
| Pennsylvania Germans | 15.5 /100 | #209 | Poor 11.0% |
| Apache | 14.8 /100 | #210 | Poor 11.0% |
Demographics Similar to Dutch by No Vehicles in Household
In terms of no vehicles in household, the demographic groups most similar to Dutch are Scotch-Irish (6.8%, a difference of 0.51%), Czech (6.9%, a difference of 0.55%), Swedish (6.8%, a difference of 0.72%), Scottish (6.8%, a difference of 1.2%), and Assyrian/Chaldean/Syriac (7.0%, a difference of 2.0%).
| Demographics | Rating | Rank | No Vehicles in Household |
| English | 100.0 /100 | #3 | Exceptional 6.5% |
| Danes | 100.0 /100 | #4 | Exceptional 6.6% |
| Yakama | 100.0 /100 | #5 | Exceptional 6.6% |
| Germans | 100.0 /100 | #6 | Exceptional 6.7% |
| Scottish | 100.0 /100 | #7 | Exceptional 6.8% |
| Swedes | 100.0 /100 | #8 | Exceptional 6.8% |
| Scotch-Irish | 100.0 /100 | #9 | Exceptional 6.8% |
| Dutch | 100.0 /100 | #10 | Exceptional 6.8% |
| Czechs | 100.0 /100 | #11 | Exceptional 6.9% |
| Assyrians/Chaldeans/Syriacs | 100.0 /100 | #12 | Exceptional 7.0% |
| Scandinavians | 100.0 /100 | #13 | Exceptional 7.0% |
| Mexicans | 100.0 /100 | #14 | Exceptional 7.0% |
| Whites/Caucasians | 100.0 /100 | #15 | Exceptional 7.0% |
| Europeans | 100.0 /100 | #16 | Exceptional 7.1% |
| Welsh | 100.0 /100 | #17 | Exceptional 7.2% |