Iroquois vs New Zealander Median Household Income
COMPARE
Iroquois
New Zealander
Median Household Income
Median Household Income Comparison
Iroquois
New Zealanders
$74,279
MEDIAN HOUSEHOLD INCOME
0.1/ 100
METRIC RATING
287th/ 347
METRIC RANK
$95,146
MEDIAN HOUSEHOLD INCOME
99.8/ 100
METRIC RATING
57th/ 347
METRIC RANK
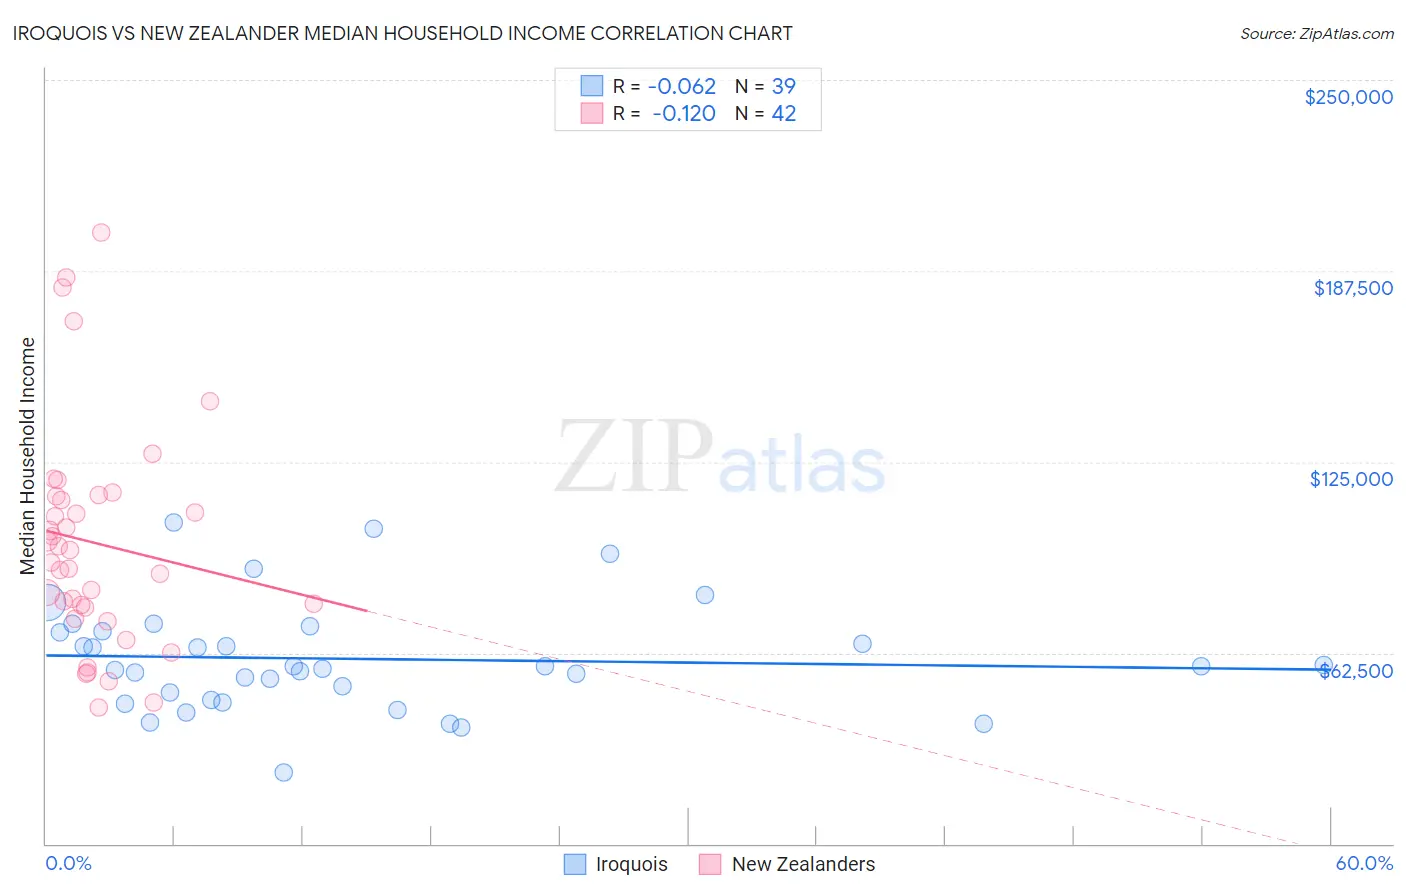
Iroquois vs New Zealander Median Household Income Correlation Chart
The statistical analysis conducted on geographies consisting of 207,210,720 people shows a slight negative correlation between the proportion of Iroquois and median household income in the United States with a correlation coefficient (R) of -0.062 and weighted average of $74,279. Similarly, the statistical analysis conducted on geographies consisting of 106,891,661 people shows a poor negative correlation between the proportion of New Zealanders and median household income in the United States with a correlation coefficient (R) of -0.120 and weighted average of $95,146, a difference of 28.1%.
Median Household Income Correlation Summary
| Measurement | Iroquois | New Zealander |
| Minimum | $23,438 | $44,447 |
| Maximum | $105,077 | $200,054 |
| Range | $81,639 | $155,607 |
| Mean | $60,531 | $98,486 |
| Median | $57,969 | $94,049 |
| Interquartile 25% (IQ1) | $47,045 | $77,381 |
| Interquartile 75% (IQ3) | $69,753 | $113,735 |
| Interquartile Range (IQR) | $22,708 | $36,354 |
| Standard Deviation (Sample) | $17,808 | $36,469 |
| Standard Deviation (Population) | $17,578 | $36,032 |
Similar Demographics by Median Household Income
Demographics Similar to Iroquois by Median Household Income
In terms of median household income, the demographic groups most similar to Iroquois are Immigrants from Somalia ($74,300, a difference of 0.030%), Immigrants from Central America ($74,217, a difference of 0.080%), Fijian ($74,205, a difference of 0.10%), Mexican ($74,399, a difference of 0.16%), and Bangladeshi ($74,112, a difference of 0.23%).
| Demographics | Rating | Rank | Median Household Income |
| Senegalese | 0.2 /100 | #280 | Tragic $74,999 |
| Immigrants | Liberia | 0.1 /100 | #281 | Tragic $74,896 |
| Central American Indians | 0.1 /100 | #282 | Tragic $74,847 |
| Cree | 0.1 /100 | #283 | Tragic $74,685 |
| Yaqui | 0.1 /100 | #284 | Tragic $74,596 |
| Mexicans | 0.1 /100 | #285 | Tragic $74,399 |
| Immigrants | Somalia | 0.1 /100 | #286 | Tragic $74,300 |
| Iroquois | 0.1 /100 | #287 | Tragic $74,279 |
| Immigrants | Central America | 0.1 /100 | #288 | Tragic $74,217 |
| Fijians | 0.1 /100 | #289 | Tragic $74,205 |
| Bangladeshis | 0.1 /100 | #290 | Tragic $74,112 |
| Hispanics or Latinos | 0.1 /100 | #291 | Tragic $73,823 |
| Comanche | 0.1 /100 | #292 | Tragic $73,747 |
| Immigrants | Cabo Verde | 0.1 /100 | #293 | Tragic $73,515 |
| Blackfeet | 0.1 /100 | #294 | Tragic $73,509 |
Demographics Similar to New Zealanders by Median Household Income
In terms of median household income, the demographic groups most similar to New Zealanders are Soviet Union ($95,098, a difference of 0.050%), Immigrants from Europe ($95,032, a difference of 0.12%), Korean ($95,018, a difference of 0.13%), Immigrants from Austria ($95,277, a difference of 0.14%), and Laotian ($94,990, a difference of 0.16%).
| Demographics | Rating | Rank | Median Household Income |
| Bulgarians | 99.9 /100 | #50 | Exceptional $96,290 |
| Estonians | 99.9 /100 | #51 | Exceptional $95,930 |
| Immigrants | South Africa | 99.9 /100 | #52 | Exceptional $95,800 |
| Paraguayans | 99.9 /100 | #53 | Exceptional $95,737 |
| Egyptians | 99.9 /100 | #54 | Exceptional $95,673 |
| Immigrants | Czechoslovakia | 99.9 /100 | #55 | Exceptional $95,319 |
| Immigrants | Austria | 99.9 /100 | #56 | Exceptional $95,277 |
| New Zealanders | 99.8 /100 | #57 | Exceptional $95,146 |
| Soviet Union | 99.8 /100 | #58 | Exceptional $95,098 |
| Immigrants | Europe | 99.8 /100 | #59 | Exceptional $95,032 |
| Koreans | 99.8 /100 | #60 | Exceptional $95,018 |
| Laotians | 99.8 /100 | #61 | Exceptional $94,990 |
| Immigrants | Norway | 99.8 /100 | #62 | Exceptional $94,846 |
| Greeks | 99.8 /100 | #63 | Exceptional $94,735 |
| Immigrants | Netherlands | 99.7 /100 | #64 | Exceptional $94,411 |