Irish vs Immigrants from Bosnia and Herzegovina Male Poverty
COMPARE
Irish
Immigrants from Bosnia and Herzegovina
Male Poverty
Male Poverty Comparison
Irish
Immigrants from Bosnia and Herzegovina
10.3%
MALE POVERTY
96.8/ 100
METRIC RATING
78th/ 347
METRIC RANK
11.0%
MALE POVERTY
65.2/ 100
METRIC RATING
153rd/ 347
METRIC RANK
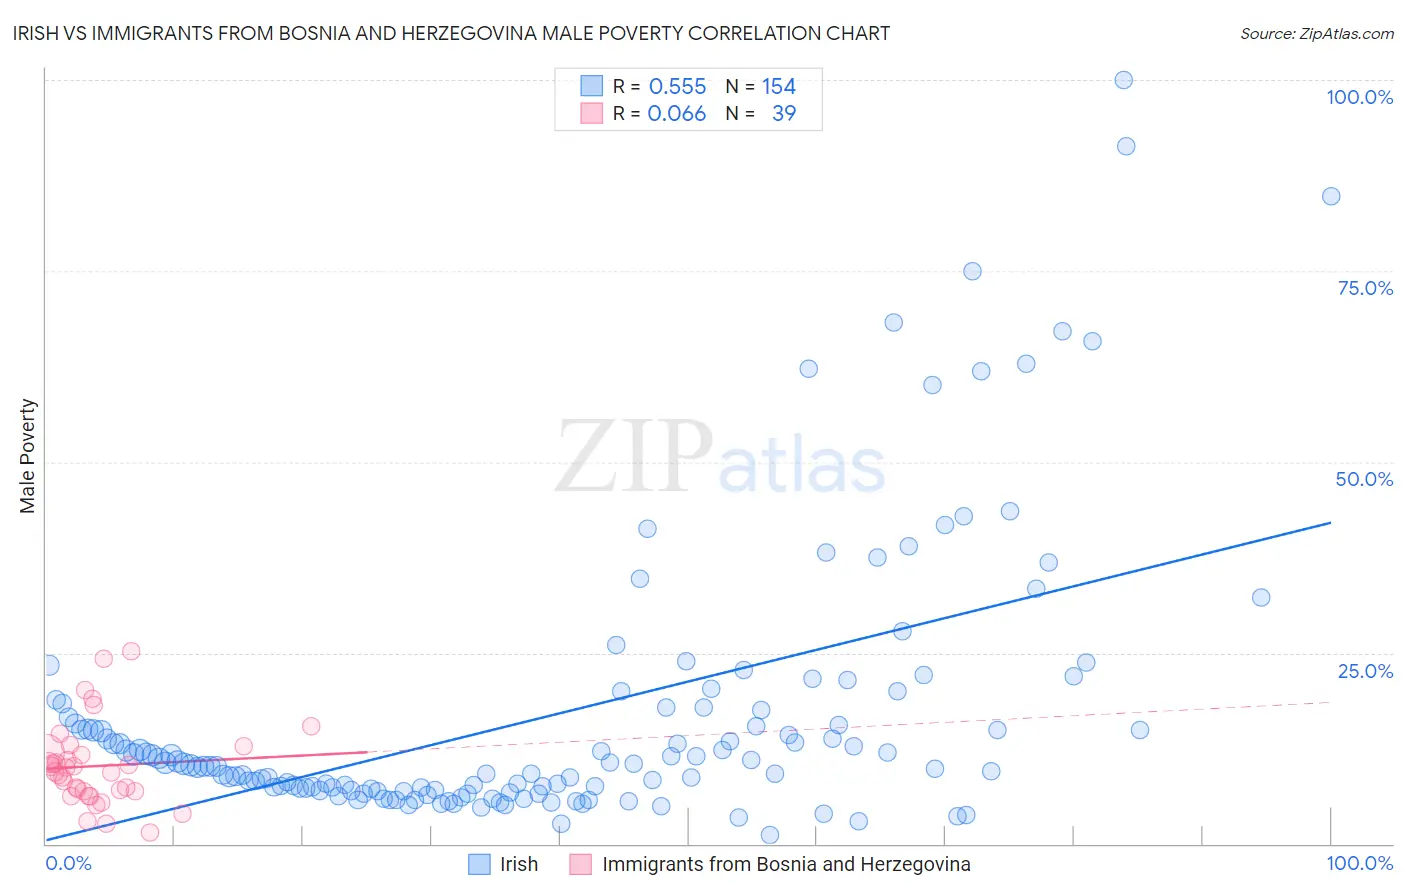
Irish vs Immigrants from Bosnia and Herzegovina Male Poverty Correlation Chart
The statistical analysis conducted on geographies consisting of 578,330,947 people shows a substantial positive correlation between the proportion of Irish and poverty level among males in the United States with a correlation coefficient (R) of 0.555 and weighted average of 10.3%. Similarly, the statistical analysis conducted on geographies consisting of 156,800,336 people shows a slight positive correlation between the proportion of Immigrants from Bosnia and Herzegovina and poverty level among males in the United States with a correlation coefficient (R) of 0.066 and weighted average of 11.0%, a difference of 7.4%.
Male Poverty Correlation Summary
| Measurement | Irish | Immigrants from Bosnia and Herzegovina |
| Minimum | 1.2% | 1.4% |
| Maximum | 100.0% | 25.3% |
| Range | 98.8% | 23.9% |
| Mean | 17.0% | 10.2% |
| Median | 10.4% | 9.4% |
| Interquartile 25% (IQ1) | 7.0% | 6.9% |
| Interquartile 75% (IQ3) | 17.8% | 12.0% |
| Interquartile Range (IQR) | 10.8% | 5.1% |
| Standard Deviation (Sample) | 18.1% | 5.4% |
| Standard Deviation (Population) | 18.1% | 5.4% |
Similar Demographics by Male Poverty
Demographics Similar to Irish by Male Poverty
In terms of male poverty, the demographic groups most similar to Irish are Immigrants from Belgium (10.3%, a difference of 0.020%), Dutch (10.2%, a difference of 0.050%), Carpatho Rusyn (10.2%, a difference of 0.060%), Immigrants from Eastern Europe (10.2%, a difference of 0.070%), and Immigrants from Asia (10.2%, a difference of 0.14%).
| Demographics | Rating | Rank | Male Poverty |
| Europeans | 97.1 /100 | #71 | Exceptional 10.2% |
| Immigrants | Canada | 97.1 /100 | #72 | Exceptional 10.2% |
| Immigrants | Asia | 97.0 /100 | #73 | Exceptional 10.2% |
| Immigrants | Eastern Europe | 96.9 /100 | #74 | Exceptional 10.2% |
| Carpatho Rusyns | 96.9 /100 | #75 | Exceptional 10.2% |
| Dutch | 96.9 /100 | #76 | Exceptional 10.2% |
| Immigrants | Belgium | 96.8 /100 | #77 | Exceptional 10.3% |
| Irish | 96.8 /100 | #78 | Exceptional 10.3% |
| Immigrants | North America | 96.5 /100 | #79 | Exceptional 10.3% |
| English | 96.4 /100 | #80 | Exceptional 10.3% |
| Belgians | 95.9 /100 | #81 | Exceptional 10.3% |
| Egyptians | 95.9 /100 | #82 | Exceptional 10.3% |
| Immigrants | Sweden | 95.7 /100 | #83 | Exceptional 10.3% |
| Czechoslovakians | 95.6 /100 | #84 | Exceptional 10.3% |
| Immigrants | England | 95.5 /100 | #85 | Exceptional 10.4% |
Demographics Similar to Immigrants from Bosnia and Herzegovina by Male Poverty
In terms of male poverty, the demographic groups most similar to Immigrants from Bosnia and Herzegovina are Immigrants from Kazakhstan (11.0%, a difference of 0.050%), Immigrants from Malaysia (11.0%, a difference of 0.050%), Costa Rican (11.0%, a difference of 0.15%), Scotch-Irish (11.0%, a difference of 0.17%), and Immigrants from Nepal (11.0%, a difference of 0.23%).
| Demographics | Rating | Rank | Male Poverty |
| Syrians | 71.4 /100 | #146 | Good 10.9% |
| Icelanders | 68.5 /100 | #147 | Good 11.0% |
| Armenians | 68.0 /100 | #148 | Good 11.0% |
| Immigrants | Venezuela | 67.9 /100 | #149 | Good 11.0% |
| Guamanians/Chamorros | 67.6 /100 | #150 | Good 11.0% |
| Venezuelans | 67.4 /100 | #151 | Good 11.0% |
| Immigrants | Nepal | 67.3 /100 | #152 | Good 11.0% |
| Immigrants | Bosnia and Herzegovina | 65.2 /100 | #153 | Good 11.0% |
| Immigrants | Kazakhstan | 64.8 /100 | #154 | Good 11.0% |
| Immigrants | Malaysia | 64.7 /100 | #155 | Good 11.0% |
| Costa Ricans | 63.9 /100 | #156 | Good 11.0% |
| Scotch-Irish | 63.7 /100 | #157 | Good 11.0% |
| Colombians | 63.0 /100 | #158 | Good 11.0% |
| Taiwanese | 62.7 /100 | #159 | Good 11.0% |
| Soviet Union | 60.3 /100 | #160 | Good 11.1% |