Irish vs Immigrants from Western Europe 2 or more Vehicles in Household
COMPARE
Irish
Immigrants from Western Europe
2 or more Vehicles in Household
2 or more Vehicles in Household Comparison
Irish
Immigrants from Western Europe
60.1%
2 OR MORE VEHICLES IN HOUSEHOLD
100.0/ 100
METRIC RATING
37th/ 347
METRIC RANK
55.4%
2 OR MORE VEHICLES IN HOUSEHOLD
51.4/ 100
METRIC RATING
173rd/ 347
METRIC RANK
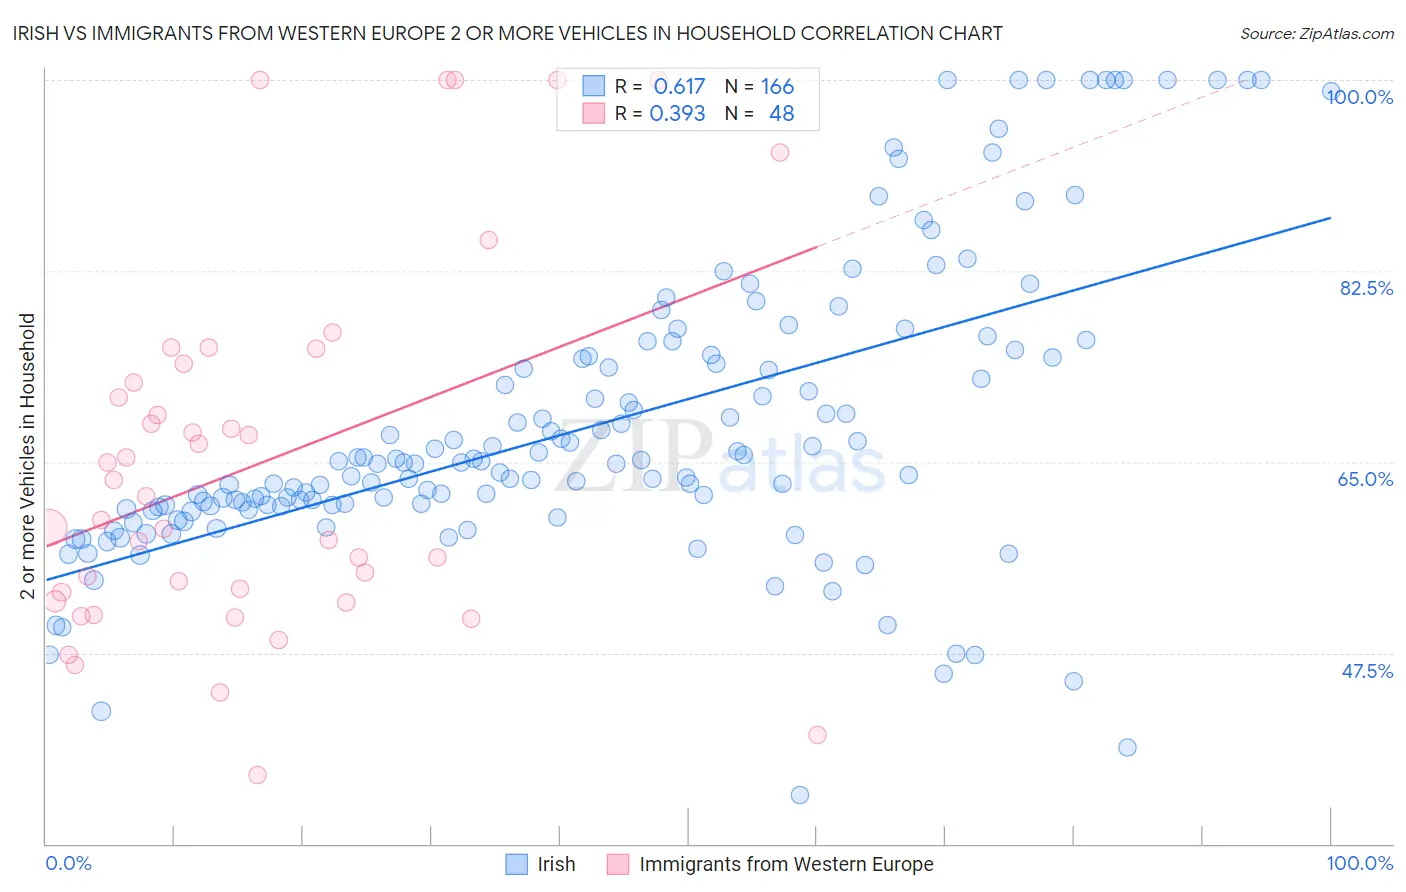
Irish vs Immigrants from Western Europe 2 or more Vehicles in Household Correlation Chart
The statistical analysis conducted on geographies consisting of 580,068,554 people shows a significant positive correlation between the proportion of Irish and percentage of households with 2 or more vehicles available in the United States with a correlation coefficient (R) of 0.617 and weighted average of 60.1%. Similarly, the statistical analysis conducted on geographies consisting of 493,846,859 people shows a mild positive correlation between the proportion of Immigrants from Western Europe and percentage of households with 2 or more vehicles available in the United States with a correlation coefficient (R) of 0.393 and weighted average of 55.4%, a difference of 8.5%.
2 or more Vehicles in Household Correlation Summary
| Measurement | Irish | Immigrants from Western Europe |
| Minimum | 34.5% | 36.3% |
| Maximum | 100.0% | 100.0% |
| Range | 65.5% | 63.7% |
| Mean | 68.2% | 64.7% |
| Median | 64.8% | 60.8% |
| Interquartile 25% (IQ1) | 60.9% | 52.7% |
| Interquartile 75% (IQ3) | 74.6% | 73.1% |
| Interquartile Range (IQR) | 13.7% | 20.5% |
| Standard Deviation (Sample) | 13.6% | 16.6% |
| Standard Deviation (Population) | 13.5% | 16.4% |
Similar Demographics by 2 or more Vehicles in Household
Demographics Similar to Irish by 2 or more Vehicles in Household
In terms of 2 or more vehicles in household, the demographic groups most similar to Irish are Chinese (60.1%, a difference of 0.030%), Immigrants from Philippines (60.1%, a difference of 0.060%), American (60.0%, a difference of 0.060%), British (60.0%, a difference of 0.070%), and Spanish (60.2%, a difference of 0.18%).
| Demographics | Rating | Rank | 2 or more Vehicles in Household |
| Finns | 100.0 /100 | #30 | Exceptional 60.3% |
| Spanish American Indians | 100.0 /100 | #31 | Exceptional 60.3% |
| Arapaho | 100.0 /100 | #32 | Exceptional 60.2% |
| Immigrants | Mexico | 100.0 /100 | #33 | Exceptional 60.2% |
| Spanish | 100.0 /100 | #34 | Exceptional 60.2% |
| Immigrants | Philippines | 100.0 /100 | #35 | Exceptional 60.1% |
| Chinese | 100.0 /100 | #36 | Exceptional 60.1% |
| Irish | 100.0 /100 | #37 | Exceptional 60.1% |
| Americans | 100.0 /100 | #38 | Exceptional 60.0% |
| British | 100.0 /100 | #39 | Exceptional 60.0% |
| Cherokee | 100.0 /100 | #40 | Exceptional 59.9% |
| Northern Europeans | 100.0 /100 | #41 | Exceptional 59.9% |
| Malaysians | 100.0 /100 | #42 | Exceptional 59.8% |
| Czechoslovakians | 100.0 /100 | #43 | Exceptional 59.8% |
| French | 100.0 /100 | #44 | Exceptional 59.8% |
Demographics Similar to Immigrants from Western Europe by 2 or more Vehicles in Household
In terms of 2 or more vehicles in household, the demographic groups most similar to Immigrants from Western Europe are Immigrants from Nicaragua (55.4%, a difference of 0.010%), Navajo (55.3%, a difference of 0.050%), Immigrants from Denmark (55.3%, a difference of 0.080%), Immigrants from Costa Rica (55.4%, a difference of 0.12%), and Immigrants from Cuba (55.3%, a difference of 0.17%).
| Demographics | Rating | Rank | 2 or more Vehicles in Household |
| Immigrants | Sri Lanka | 58.3 /100 | #166 | Average 55.5% |
| Kenyans | 58.1 /100 | #167 | Average 55.5% |
| French American Indians | 56.7 /100 | #168 | Average 55.5% |
| Immigrants | Austria | 56.3 /100 | #169 | Average 55.5% |
| Romanians | 55.8 /100 | #170 | Average 55.5% |
| Immigrants | Costa Rica | 54.4 /100 | #171 | Average 55.4% |
| Immigrants | Nicaragua | 51.6 /100 | #172 | Average 55.4% |
| Immigrants | Western Europe | 51.4 /100 | #173 | Average 55.4% |
| Navajo | 50.0 /100 | #174 | Average 55.3% |
| Immigrants | Denmark | 49.4 /100 | #175 | Average 55.3% |
| Immigrants | Cuba | 47.0 /100 | #176 | Average 55.3% |
| Menominee | 46.2 /100 | #177 | Average 55.3% |
| Immigrants | Sweden | 45.3 /100 | #178 | Average 55.2% |
| Alaskan Athabascans | 42.9 /100 | #179 | Average 55.2% |
| Immigrants | Kenya | 40.4 /100 | #180 | Average 55.1% |