Irish vs Indian (Asian) 2 or more Vehicles in Household
COMPARE
Irish
Indian (Asian)
2 or more Vehicles in Household
2 or more Vehicles in Household Comparison
Irish
Indians (Asian)
60.1%
2 OR MORE VEHICLES IN HOUSEHOLD
100.0/ 100
METRIC RATING
37th/ 347
METRIC RANK
53.1%
2 OR MORE VEHICLES IN HOUSEHOLD
1.7/ 100
METRIC RATING
244th/ 347
METRIC RANK
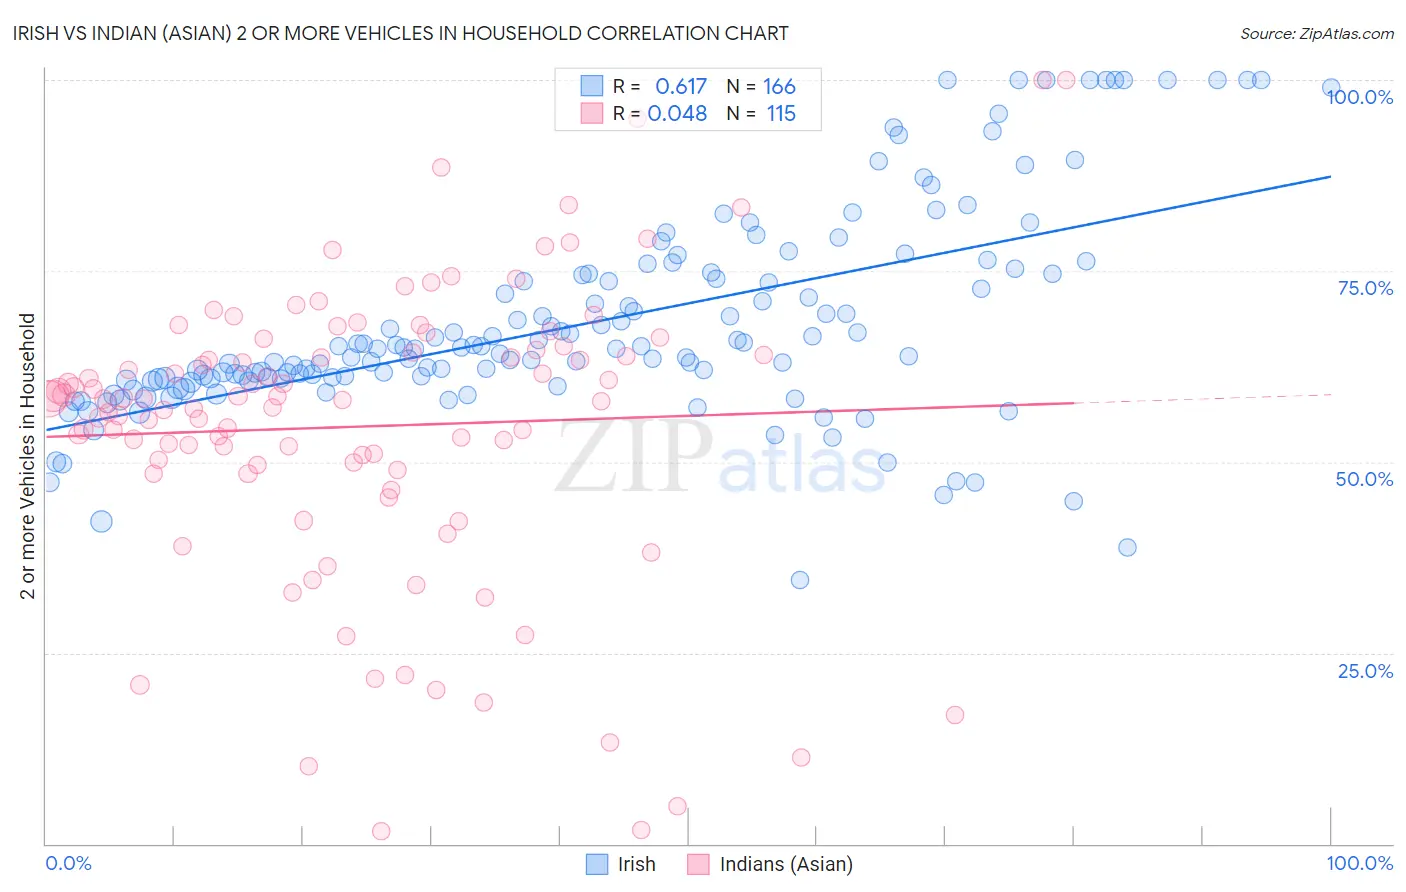
Irish vs Indian (Asian) 2 or more Vehicles in Household Correlation Chart
The statistical analysis conducted on geographies consisting of 580,068,554 people shows a significant positive correlation between the proportion of Irish and percentage of households with 2 or more vehicles available in the United States with a correlation coefficient (R) of 0.617 and weighted average of 60.1%. Similarly, the statistical analysis conducted on geographies consisting of 494,844,203 people shows no correlation between the proportion of Indians (Asian) and percentage of households with 2 or more vehicles available in the United States with a correlation coefficient (R) of 0.048 and weighted average of 53.1%, a difference of 13.1%.
2 or more Vehicles in Household Correlation Summary
| Measurement | Irish | Indian (Asian) |
| Minimum | 34.5% | 1.7% |
| Maximum | 100.0% | 100.0% |
| Range | 65.5% | 98.3% |
| Mean | 68.2% | 54.6% |
| Median | 64.8% | 58.2% |
| Interquartile 25% (IQ1) | 60.9% | 49.0% |
| Interquartile 75% (IQ3) | 74.6% | 64.6% |
| Interquartile Range (IQR) | 13.7% | 15.6% |
| Standard Deviation (Sample) | 13.6% | 19.2% |
| Standard Deviation (Population) | 13.5% | 19.2% |
Similar Demographics by 2 or more Vehicles in Household
Demographics Similar to Irish by 2 or more Vehicles in Household
In terms of 2 or more vehicles in household, the demographic groups most similar to Irish are Chinese (60.1%, a difference of 0.030%), Immigrants from Philippines (60.1%, a difference of 0.060%), American (60.0%, a difference of 0.060%), British (60.0%, a difference of 0.070%), and Spanish (60.2%, a difference of 0.18%).
| Demographics | Rating | Rank | 2 or more Vehicles in Household |
| Finns | 100.0 /100 | #30 | Exceptional 60.3% |
| Spanish American Indians | 100.0 /100 | #31 | Exceptional 60.3% |
| Arapaho | 100.0 /100 | #32 | Exceptional 60.2% |
| Immigrants | Mexico | 100.0 /100 | #33 | Exceptional 60.2% |
| Spanish | 100.0 /100 | #34 | Exceptional 60.2% |
| Immigrants | Philippines | 100.0 /100 | #35 | Exceptional 60.1% |
| Chinese | 100.0 /100 | #36 | Exceptional 60.1% |
| Irish | 100.0 /100 | #37 | Exceptional 60.1% |
| Americans | 100.0 /100 | #38 | Exceptional 60.0% |
| British | 100.0 /100 | #39 | Exceptional 60.0% |
| Cherokee | 100.0 /100 | #40 | Exceptional 59.9% |
| Northern Europeans | 100.0 /100 | #41 | Exceptional 59.9% |
| Malaysians | 100.0 /100 | #42 | Exceptional 59.8% |
| Czechoslovakians | 100.0 /100 | #43 | Exceptional 59.8% |
| French | 100.0 /100 | #44 | Exceptional 59.8% |
Demographics Similar to Indians (Asian) by 2 or more Vehicles in Household
In terms of 2 or more vehicles in household, the demographic groups most similar to Indians (Asian) are Ethiopian (53.1%, a difference of 0.040%), Immigrants from Ethiopia (53.0%, a difference of 0.12%), Immigrants from Eastern Asia (53.2%, a difference of 0.23%), Immigrants from Sierra Leone (53.2%, a difference of 0.24%), and Immigrants from Europe (53.2%, a difference of 0.26%).
| Demographics | Rating | Rank | 2 or more Vehicles in Household |
| Macedonians | 2.4 /100 | #237 | Tragic 53.3% |
| Immigrants | Armenia | 2.3 /100 | #238 | Tragic 53.3% |
| Cambodians | 2.3 /100 | #239 | Tragic 53.3% |
| Immigrants | Europe | 2.1 /100 | #240 | Tragic 53.2% |
| Immigrants | Sierra Leone | 2.1 /100 | #241 | Tragic 53.2% |
| Immigrants | Eastern Asia | 2.1 /100 | #242 | Tragic 53.2% |
| Ethiopians | 1.7 /100 | #243 | Tragic 53.1% |
| Indians (Asian) | 1.7 /100 | #244 | Tragic 53.1% |
| Immigrants | Ethiopia | 1.5 /100 | #245 | Tragic 53.0% |
| Immigrants | Nigeria | 1.2 /100 | #246 | Tragic 52.9% |
| Sierra Leoneans | 1.2 /100 | #247 | Tragic 52.9% |
| Colombians | 1.1 /100 | #248 | Tragic 52.9% |
| Immigrants | Brazil | 1.0 /100 | #249 | Tragic 52.8% |
| Mongolians | 1.0 /100 | #250 | Tragic 52.8% |
| Immigrants | Sudan | 1.0 /100 | #251 | Tragic 52.8% |