Immigrants from Sierra Leone vs English 4 or more Vehicles in Household
COMPARE
Immigrants from Sierra Leone
English
4 or more Vehicles in Household
4 or more Vehicles in Household Comparison
Immigrants from Sierra Leone
English
6.1%
4 OR MORE VEHICLES IN HOUSEHOLD
20.5/ 100
METRIC RATING
203rd/ 347
METRIC RANK
7.6%
4 OR MORE VEHICLES IN HOUSEHOLD
100.0/ 100
METRIC RATING
56th/ 347
METRIC RANK
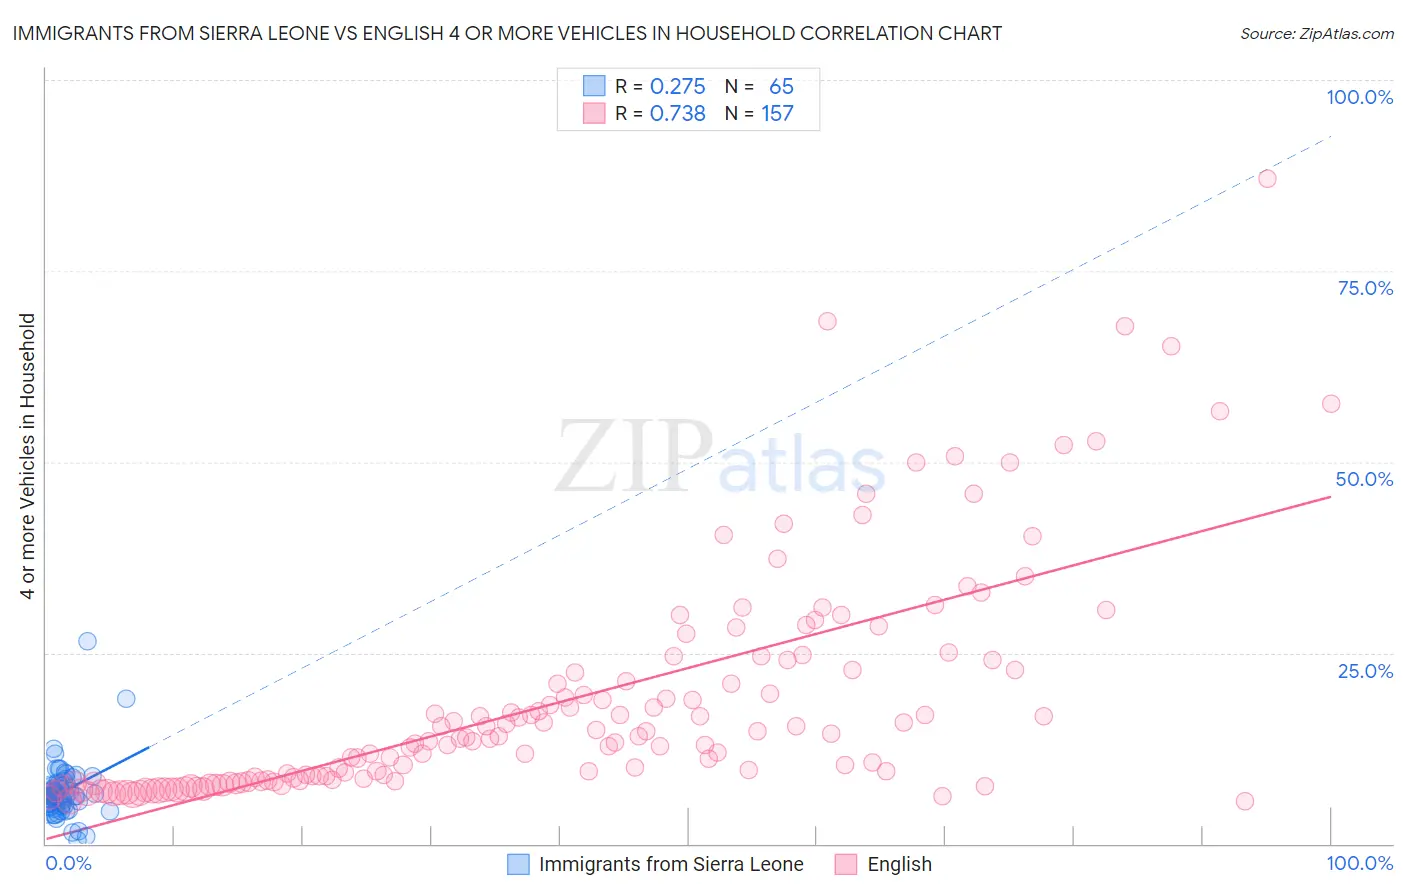
Immigrants from Sierra Leone vs English 4 or more Vehicles in Household Correlation Chart
The statistical analysis conducted on geographies consisting of 101,342,659 people shows a weak positive correlation between the proportion of Immigrants from Sierra Leone and percentage of households with 4 or more vehicles available in the United States with a correlation coefficient (R) of 0.275 and weighted average of 6.1%. Similarly, the statistical analysis conducted on geographies consisting of 575,671,099 people shows a strong positive correlation between the proportion of English and percentage of households with 4 or more vehicles available in the United States with a correlation coefficient (R) of 0.738 and weighted average of 7.6%, a difference of 24.9%.
4 or more Vehicles in Household Correlation Summary
| Measurement | Immigrants from Sierra Leone | English |
| Minimum | 0.48% | 5.6% |
| Maximum | 26.5% | 87.1% |
| Range | 26.0% | 81.5% |
| Mean | 6.8% | 18.6% |
| Median | 6.3% | 13.7% |
| Interquartile 25% (IQ1) | 5.0% | 8.3% |
| Interquartile 75% (IQ3) | 7.8% | 22.8% |
| Interquartile Range (IQR) | 2.7% | 14.5% |
| Standard Deviation (Sample) | 3.7% | 14.8% |
| Standard Deviation (Population) | 3.7% | 14.8% |
Similar Demographics by 4 or more Vehicles in Household
Demographics Similar to Immigrants from Sierra Leone by 4 or more Vehicles in Household
In terms of 4 or more vehicles in household, the demographic groups most similar to Immigrants from Sierra Leone are Immigrants from Belize (6.1%, a difference of 0.10%), Immigrants from South Central Asia (6.1%, a difference of 0.14%), Egyptian (6.1%, a difference of 0.15%), Honduran (6.1%, a difference of 0.19%), and Immigrants from Norway (6.1%, a difference of 0.20%).
| Demographics | Rating | Rank | 4 or more Vehicles in Household |
| Tsimshian | 26.4 /100 | #196 | Fair 6.2% |
| Immigrants | Sri Lanka | 23.7 /100 | #197 | Fair 6.1% |
| Immigrants | Portugal | 22.3 /100 | #198 | Fair 6.1% |
| Immigrants | Norway | 21.8 /100 | #199 | Fair 6.1% |
| Latvians | 21.7 /100 | #200 | Fair 6.1% |
| Egyptians | 21.4 /100 | #201 | Fair 6.1% |
| Immigrants | South Central Asia | 21.3 /100 | #202 | Fair 6.1% |
| Immigrants | Sierra Leone | 20.5 /100 | #203 | Fair 6.1% |
| Immigrants | Belize | 19.8 /100 | #204 | Poor 6.1% |
| Hondurans | 19.3 /100 | #205 | Poor 6.1% |
| Kenyans | 18.5 /100 | #206 | Poor 6.1% |
| Immigrants | Chile | 16.9 /100 | #207 | Poor 6.1% |
| Immigrants | Nigeria | 15.6 /100 | #208 | Poor 6.1% |
| Immigrants | Honduras | 15.4 /100 | #209 | Poor 6.1% |
| Immigrants | Zimbabwe | 15.1 /100 | #210 | Poor 6.0% |
Demographics Similar to English by 4 or more Vehicles in Household
In terms of 4 or more vehicles in household, the demographic groups most similar to English are Immigrants from Oceania (7.6%, a difference of 0.010%), Pennsylvania German (7.6%, a difference of 0.12%), Swedish (7.6%, a difference of 0.12%), Hispanic or Latino (7.6%, a difference of 0.16%), and Spaniard (7.6%, a difference of 0.22%).
| Demographics | Rating | Rank | 4 or more Vehicles in Household |
| Cherokee | 100.0 /100 | #49 | Exceptional 7.7% |
| Immigrants | El Salvador | 100.0 /100 | #50 | Exceptional 7.7% |
| Immigrants | Laos | 100.0 /100 | #51 | Exceptional 7.7% |
| Japanese | 100.0 /100 | #52 | Exceptional 7.7% |
| Malaysians | 100.0 /100 | #53 | Exceptional 7.7% |
| Dutch | 100.0 /100 | #54 | Exceptional 7.7% |
| Immigrants | Oceania | 100.0 /100 | #55 | Exceptional 7.6% |
| English | 100.0 /100 | #56 | Exceptional 7.6% |
| Pennsylvania Germans | 100.0 /100 | #57 | Exceptional 7.6% |
| Swedes | 100.0 /100 | #58 | Exceptional 7.6% |
| Hispanics or Latinos | 100.0 /100 | #59 | Exceptional 7.6% |
| Spaniards | 100.0 /100 | #60 | Exceptional 7.6% |
| Europeans | 100.0 /100 | #61 | Exceptional 7.6% |
| Chippewa | 100.0 /100 | #62 | Exceptional 7.6% |
| Immigrants | Micronesia | 100.0 /100 | #63 | Exceptional 7.6% |