Inupiat vs Immigrants from South Africa 2 or more Vehicles in Household
COMPARE
Inupiat
Immigrants from South Africa
2 or more Vehicles in Household
2 or more Vehicles in Household Comparison
Inupiat
Immigrants from South Africa
42.6%
2 OR MORE VEHICLES IN HOUSEHOLD
0.0/ 100
METRIC RATING
328th/ 347
METRIC RANK
56.7%
2 OR MORE VEHICLES IN HOUSEHOLD
92.5/ 100
METRIC RATING
122nd/ 347
METRIC RANK
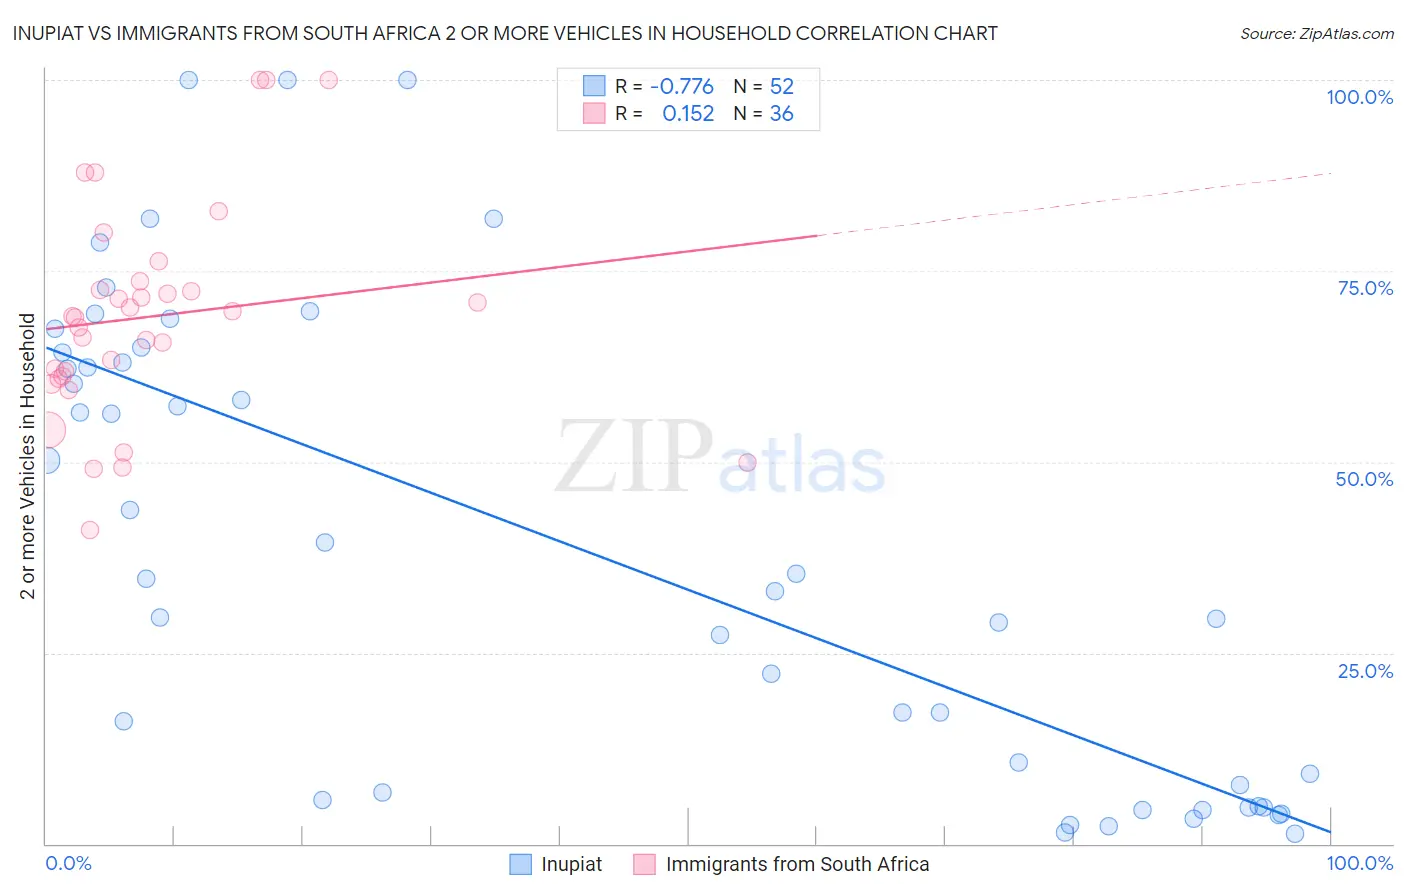
Inupiat vs Immigrants from South Africa 2 or more Vehicles in Household Correlation Chart
The statistical analysis conducted on geographies consisting of 96,302,889 people shows a strong negative correlation between the proportion of Inupiat and percentage of households with 2 or more vehicles available in the United States with a correlation coefficient (R) of -0.776 and weighted average of 42.6%. Similarly, the statistical analysis conducted on geographies consisting of 233,271,221 people shows a poor positive correlation between the proportion of Immigrants from South Africa and percentage of households with 2 or more vehicles available in the United States with a correlation coefficient (R) of 0.152 and weighted average of 56.7%, a difference of 33.1%.
2 or more Vehicles in Household Correlation Summary
| Measurement | Inupiat | Immigrants from South Africa |
| Minimum | 1.4% | 41.1% |
| Maximum | 100.0% | 100.0% |
| Range | 98.6% | 58.9% |
| Mean | 38.5% | 69.1% |
| Median | 33.9% | 69.0% |
| Interquartile 25% (IQ1) | 6.2% | 61.1% |
| Interquartile 75% (IQ3) | 63.7% | 73.1% |
| Interquartile Range (IQR) | 57.5% | 12.0% |
| Standard Deviation (Sample) | 30.7% | 14.1% |
| Standard Deviation (Population) | 30.4% | 13.9% |
Similar Demographics by 2 or more Vehicles in Household
Demographics Similar to Inupiat by 2 or more Vehicles in Household
In terms of 2 or more vehicles in household, the demographic groups most similar to Inupiat are Immigrants from Yemen (42.8%, a difference of 0.50%), Immigrants from Senegal (43.0%, a difference of 0.91%), Immigrants from West Indies (43.1%, a difference of 1.1%), Ecuadorian (42.0%, a difference of 1.6%), and Immigrants from Cabo Verde (43.3%, a difference of 1.6%).
| Demographics | Rating | Rank | 2 or more Vehicles in Household |
| Immigrants | Jamaica | 0.0 /100 | #321 | Tragic 44.5% |
| Senegalese | 0.0 /100 | #322 | Tragic 44.2% |
| Immigrants | Caribbean | 0.0 /100 | #323 | Tragic 44.2% |
| Immigrants | Cabo Verde | 0.0 /100 | #324 | Tragic 43.3% |
| Immigrants | West Indies | 0.0 /100 | #325 | Tragic 43.1% |
| Immigrants | Senegal | 0.0 /100 | #326 | Tragic 43.0% |
| Immigrants | Yemen | 0.0 /100 | #327 | Tragic 42.8% |
| Inupiat | 0.0 /100 | #328 | Tragic 42.6% |
| Ecuadorians | 0.0 /100 | #329 | Tragic 42.0% |
| Immigrants | Dominica | 0.0 /100 | #330 | Tragic 41.6% |
| West Indians | 0.0 /100 | #331 | Tragic 41.3% |
| Trinidadians and Tobagonians | 0.0 /100 | #332 | Tragic 40.9% |
| Immigrants | Ecuador | 0.0 /100 | #333 | Tragic 40.5% |
| Immigrants | Trinidad and Tobago | 0.0 /100 | #334 | Tragic 40.3% |
| Immigrants | Bangladesh | 0.0 /100 | #335 | Tragic 38.8% |
Demographics Similar to Immigrants from South Africa by 2 or more Vehicles in Household
In terms of 2 or more vehicles in household, the demographic groups most similar to Immigrants from South Africa are Australian (56.7%, a difference of 0.090%), New Zealander (56.7%, a difference of 0.10%), Tsimshian (56.7%, a difference of 0.12%), Sioux (56.8%, a difference of 0.20%), and Estonian (56.6%, a difference of 0.20%).
| Demographics | Rating | Rank | 2 or more Vehicles in Household |
| Chippewa | 96.6 /100 | #115 | Exceptional 57.2% |
| Immigrants | Jordan | 96.6 /100 | #116 | Exceptional 57.2% |
| Iraqis | 95.8 /100 | #117 | Exceptional 57.1% |
| Asians | 95.1 /100 | #118 | Exceptional 57.0% |
| Natives/Alaskans | 95.0 /100 | #119 | Exceptional 57.0% |
| Costa Ricans | 94.7 /100 | #120 | Exceptional 56.9% |
| Sioux | 93.8 /100 | #121 | Exceptional 56.8% |
| Immigrants | South Africa | 92.5 /100 | #122 | Exceptional 56.7% |
| Australians | 91.8 /100 | #123 | Exceptional 56.7% |
| New Zealanders | 91.8 /100 | #124 | Exceptional 56.7% |
| Tsimshian | 91.6 /100 | #125 | Exceptional 56.7% |
| Estonians | 90.9 /100 | #126 | Exceptional 56.6% |
| Immigrants | Thailand | 90.7 /100 | #127 | Exceptional 56.6% |
| Immigrants | South Central Asia | 90.5 /100 | #128 | Exceptional 56.6% |
| Ute | 90.4 /100 | #129 | Exceptional 56.6% |