Indonesian vs Immigrants from Nigeria Householder Income Ages 25 - 44 years
COMPARE
Indonesian
Immigrants from Nigeria
Householder Income Ages 25 - 44 years
Householder Income Ages 25 - 44 years Comparison
Indonesians
Immigrants from Nigeria
$79,543
HOUSEHOLDER INCOME AGES 25 - 44 YEARS
0.0/ 100
METRIC RATING
311th/ 347
METRIC RANK
$86,589
HOUSEHOLDER INCOME AGES 25 - 44 YEARS
1.2/ 100
METRIC RATING
247th/ 347
METRIC RANK
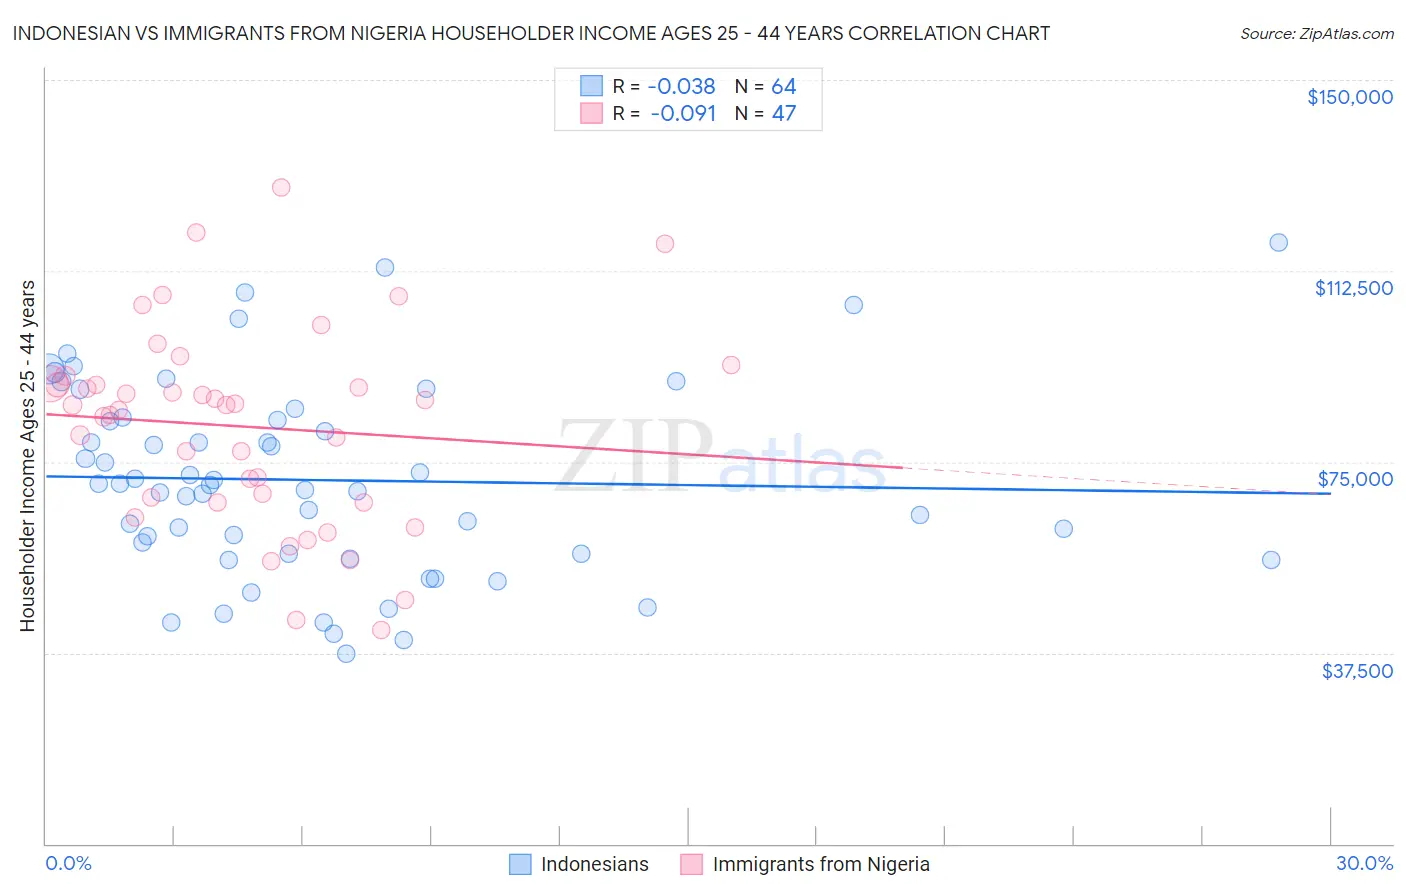
Indonesian vs Immigrants from Nigeria Householder Income Ages 25 - 44 years Correlation Chart
The statistical analysis conducted on geographies consisting of 162,548,199 people shows no correlation between the proportion of Indonesians and household income with householder between the ages 25 and 44 in the United States with a correlation coefficient (R) of -0.038 and weighted average of $79,543. Similarly, the statistical analysis conducted on geographies consisting of 283,094,597 people shows a slight negative correlation between the proportion of Immigrants from Nigeria and household income with householder between the ages 25 and 44 in the United States with a correlation coefficient (R) of -0.091 and weighted average of $86,589, a difference of 8.9%.
Householder Income Ages 25 - 44 years Correlation Summary
| Measurement | Indonesian | Immigrants from Nigeria |
| Minimum | $37,365 | $42,092 |
| Maximum | $118,125 | $128,882 |
| Range | $80,760 | $86,790 |
| Mean | $71,416 | $81,924 |
| Median | $70,496 | $86,086 |
| Interquartile 25% (IQ1) | $56,977 | $67,086 |
| Interquartile 75% (IQ3) | $83,474 | $90,392 |
| Interquartile Range (IQR) | $26,497 | $23,305 |
| Standard Deviation (Sample) | $18,886 | $19,417 |
| Standard Deviation (Population) | $18,738 | $19,209 |
Similar Demographics by Householder Income Ages 25 - 44 years
Demographics Similar to Indonesians by Householder Income Ages 25 - 44 years
In terms of householder income ages 25 - 44 years, the demographic groups most similar to Indonesians are Immigrants from Haiti ($79,391, a difference of 0.19%), Menominee ($79,358, a difference of 0.23%), Cheyenne ($79,152, a difference of 0.49%), Fijian ($79,956, a difference of 0.52%), and Chippewa ($80,005, a difference of 0.58%).
| Demographics | Rating | Rank | Householder Income Ages 25 - 44 years |
| Immigrants | Caribbean | 0.0 /100 | #304 | Tragic $80,326 |
| Immigrants | Dominican Republic | 0.0 /100 | #305 | Tragic $80,319 |
| Apache | 0.0 /100 | #306 | Tragic $80,260 |
| Haitians | 0.0 /100 | #307 | Tragic $80,055 |
| Immigrants | Central America | 0.0 /100 | #308 | Tragic $80,012 |
| Chippewa | 0.0 /100 | #309 | Tragic $80,005 |
| Fijians | 0.0 /100 | #310 | Tragic $79,956 |
| Indonesians | 0.0 /100 | #311 | Tragic $79,543 |
| Immigrants | Haiti | 0.0 /100 | #312 | Tragic $79,391 |
| Menominee | 0.0 /100 | #313 | Tragic $79,358 |
| Cheyenne | 0.0 /100 | #314 | Tragic $79,152 |
| Ottawa | 0.0 /100 | #315 | Tragic $79,012 |
| Africans | 0.0 /100 | #316 | Tragic $78,986 |
| U.S. Virgin Islanders | 0.0 /100 | #317 | Tragic $78,911 |
| Immigrants | Mexico | 0.0 /100 | #318 | Tragic $78,809 |
Demographics Similar to Immigrants from Nigeria by Householder Income Ages 25 - 44 years
In terms of householder income ages 25 - 44 years, the demographic groups most similar to Immigrants from Nigeria are Immigrants from Burma/Myanmar ($86,736, a difference of 0.17%), Immigrants from El Salvador ($86,913, a difference of 0.37%), Immigrants from Venezuela ($87,038, a difference of 0.52%), Immigrants from West Indies ($87,063, a difference of 0.55%), and Immigrants from Sudan ($86,109, a difference of 0.56%).
| Demographics | Rating | Rank | Householder Income Ages 25 - 44 years |
| Nicaraguans | 2.2 /100 | #240 | Tragic $87,751 |
| Nigerians | 2.2 /100 | #241 | Tragic $87,730 |
| West Indians | 1.7 /100 | #242 | Tragic $87,205 |
| Immigrants | West Indies | 1.5 /100 | #243 | Tragic $87,063 |
| Immigrants | Venezuela | 1.5 /100 | #244 | Tragic $87,038 |
| Immigrants | El Salvador | 1.4 /100 | #245 | Tragic $86,913 |
| Immigrants | Burma/Myanmar | 1.3 /100 | #246 | Tragic $86,736 |
| Immigrants | Nigeria | 1.2 /100 | #247 | Tragic $86,589 |
| Immigrants | Sudan | 0.9 /100 | #248 | Tragic $86,109 |
| French American Indians | 0.8 /100 | #249 | Tragic $85,899 |
| Pennsylvania Germans | 0.8 /100 | #250 | Tragic $85,836 |
| Cape Verdeans | 0.8 /100 | #251 | Tragic $85,758 |
| Immigrants | Western Africa | 0.7 /100 | #252 | Tragic $85,676 |
| British West Indians | 0.7 /100 | #253 | Tragic $85,565 |
| Immigrants | Laos | 0.7 /100 | #254 | Tragic $85,553 |