Native Hawaiian vs Immigrants from Nigeria 3 or more Vehicles in Household
COMPARE
Native Hawaiian
Immigrants from Nigeria
3 or more Vehicles in Household
3 or more Vehicles in Household Comparison
Native Hawaiians
Immigrants from Nigeria
24.9%
3 OR MORE VEHICLES IN HOUSEHOLD
100.0/ 100
METRIC RATING
9th/ 347
METRIC RANK
18.7%
3 OR MORE VEHICLES IN HOUSEHOLD
10.3/ 100
METRIC RATING
216th/ 347
METRIC RANK
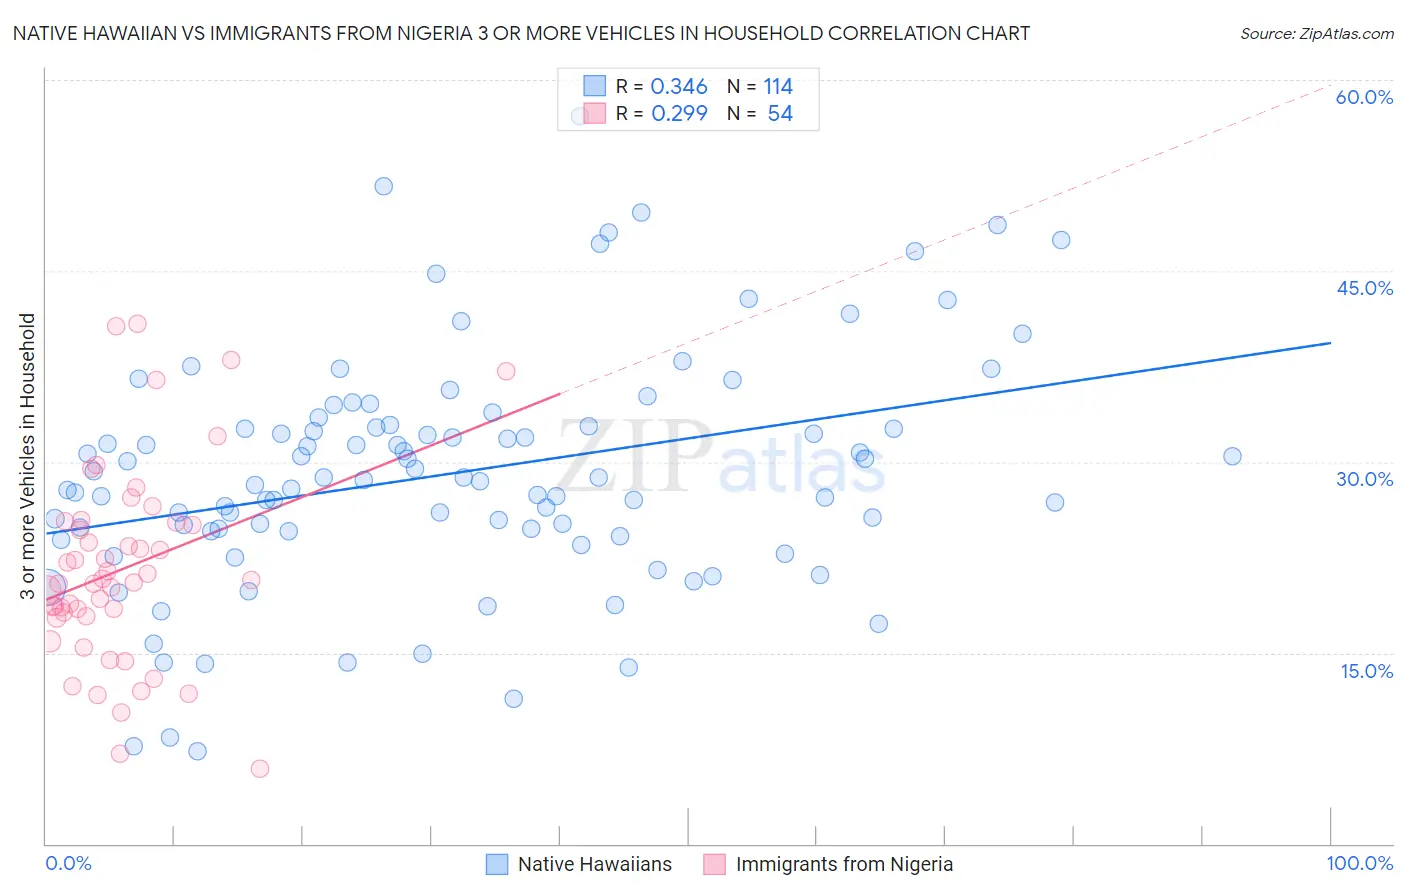
Native Hawaiian vs Immigrants from Nigeria 3 or more Vehicles in Household Correlation Chart
The statistical analysis conducted on geographies consisting of 331,830,986 people shows a mild positive correlation between the proportion of Native Hawaiians and percentage of households with 3 or more vehicles available in the United States with a correlation coefficient (R) of 0.346 and weighted average of 24.9%. Similarly, the statistical analysis conducted on geographies consisting of 283,187,528 people shows a weak positive correlation between the proportion of Immigrants from Nigeria and percentage of households with 3 or more vehicles available in the United States with a correlation coefficient (R) of 0.299 and weighted average of 18.7%, a difference of 33.4%.
3 or more Vehicles in Household Correlation Summary
| Measurement | Native Hawaiian | Immigrants from Nigeria |
| Minimum | 7.3% | 5.9% |
| Maximum | 57.1% | 40.9% |
| Range | 49.8% | 35.0% |
| Mean | 29.1% | 21.6% |
| Median | 28.7% | 20.6% |
| Interquartile 25% (IQ1) | 24.6% | 17.9% |
| Interquartile 75% (IQ3) | 32.8% | 25.2% |
| Interquartile Range (IQR) | 8.2% | 7.3% |
| Standard Deviation (Sample) | 9.2% | 7.8% |
| Standard Deviation (Population) | 9.2% | 7.7% |
Similar Demographics by 3 or more Vehicles in Household
Demographics Similar to Native Hawaiians by 3 or more Vehicles in Household
In terms of 3 or more vehicles in household, the demographic groups most similar to Native Hawaiians are Nepalese (24.9%, a difference of 0.090%), Samoan (25.0%, a difference of 0.10%), Shoshone (24.9%, a difference of 0.19%), Danish (24.7%, a difference of 0.88%), and Mexican (24.7%, a difference of 0.96%).
| Demographics | Rating | Rank | 3 or more Vehicles in Household |
| Spanish American Indians | 100.0 /100 | #2 | Exceptional 26.9% |
| Tongans | 100.0 /100 | #3 | Exceptional 26.5% |
| Arapaho | 100.0 /100 | #4 | Exceptional 26.4% |
| Puget Sound Salish | 100.0 /100 | #5 | Exceptional 26.4% |
| Immigrants | Fiji | 100.0 /100 | #6 | Exceptional 26.1% |
| Colville | 100.0 /100 | #7 | Exceptional 25.8% |
| Samoans | 100.0 /100 | #8 | Exceptional 25.0% |
| Native Hawaiians | 100.0 /100 | #9 | Exceptional 24.9% |
| Nepalese | 100.0 /100 | #10 | Exceptional 24.9% |
| Shoshone | 100.0 /100 | #11 | Exceptional 24.9% |
| Danes | 100.0 /100 | #12 | Exceptional 24.7% |
| Mexicans | 100.0 /100 | #13 | Exceptional 24.7% |
| Immigrants | Mexico | 100.0 /100 | #14 | Exceptional 24.6% |
| Hawaiians | 100.0 /100 | #15 | Exceptional 24.3% |
| Basques | 100.0 /100 | #16 | Exceptional 24.3% |
Demographics Similar to Immigrants from Nigeria by 3 or more Vehicles in Household
In terms of 3 or more vehicles in household, the demographic groups most similar to Immigrants from Nigeria are Immigrants from Italy (18.7%, a difference of 0.020%), Eastern European (18.7%, a difference of 0.060%), Immigrants from Sierra Leone (18.7%, a difference of 0.10%), Panamanian (18.8%, a difference of 0.26%), and Immigrants from Cuba (18.8%, a difference of 0.26%).
| Demographics | Rating | Rank | 3 or more Vehicles in Household |
| Immigrants | Egypt | 13.5 /100 | #209 | Poor 18.8% |
| Bulgarians | 13.1 /100 | #210 | Poor 18.8% |
| Immigrants | Kenya | 12.4 /100 | #211 | Poor 18.8% |
| Panamanians | 11.6 /100 | #212 | Poor 18.8% |
| Immigrants | Cuba | 11.6 /100 | #213 | Poor 18.8% |
| Immigrants | Sierra Leone | 10.8 /100 | #214 | Poor 18.7% |
| Eastern Europeans | 10.6 /100 | #215 | Poor 18.7% |
| Immigrants | Nigeria | 10.3 /100 | #216 | Poor 18.7% |
| Immigrants | Italy | 10.2 /100 | #217 | Poor 18.7% |
| Immigrants | Portugal | 8.9 /100 | #218 | Tragic 18.6% |
| Immigrants | Armenia | 8.6 /100 | #219 | Tragic 18.6% |
| Nigerians | 7.9 /100 | #220 | Tragic 18.6% |
| Immigrants | Poland | 7.5 /100 | #221 | Tragic 18.6% |
| Belizeans | 7.3 /100 | #222 | Tragic 18.6% |
| Immigrants | Czechoslovakia | 5.9 /100 | #223 | Tragic 18.5% |