Indonesian vs Immigrants from Nigeria Family Households
COMPARE
Indonesian
Immigrants from Nigeria
Family Households
Family Households Comparison
Indonesians
Immigrants from Nigeria
61.5%
FAMILY HOUSEHOLDS
0.0/ 100
METRIC RATING
326th/ 347
METRIC RANK
64.4%
FAMILY HOUSEHOLDS
60.1/ 100
METRIC RATING
164th/ 347
METRIC RANK
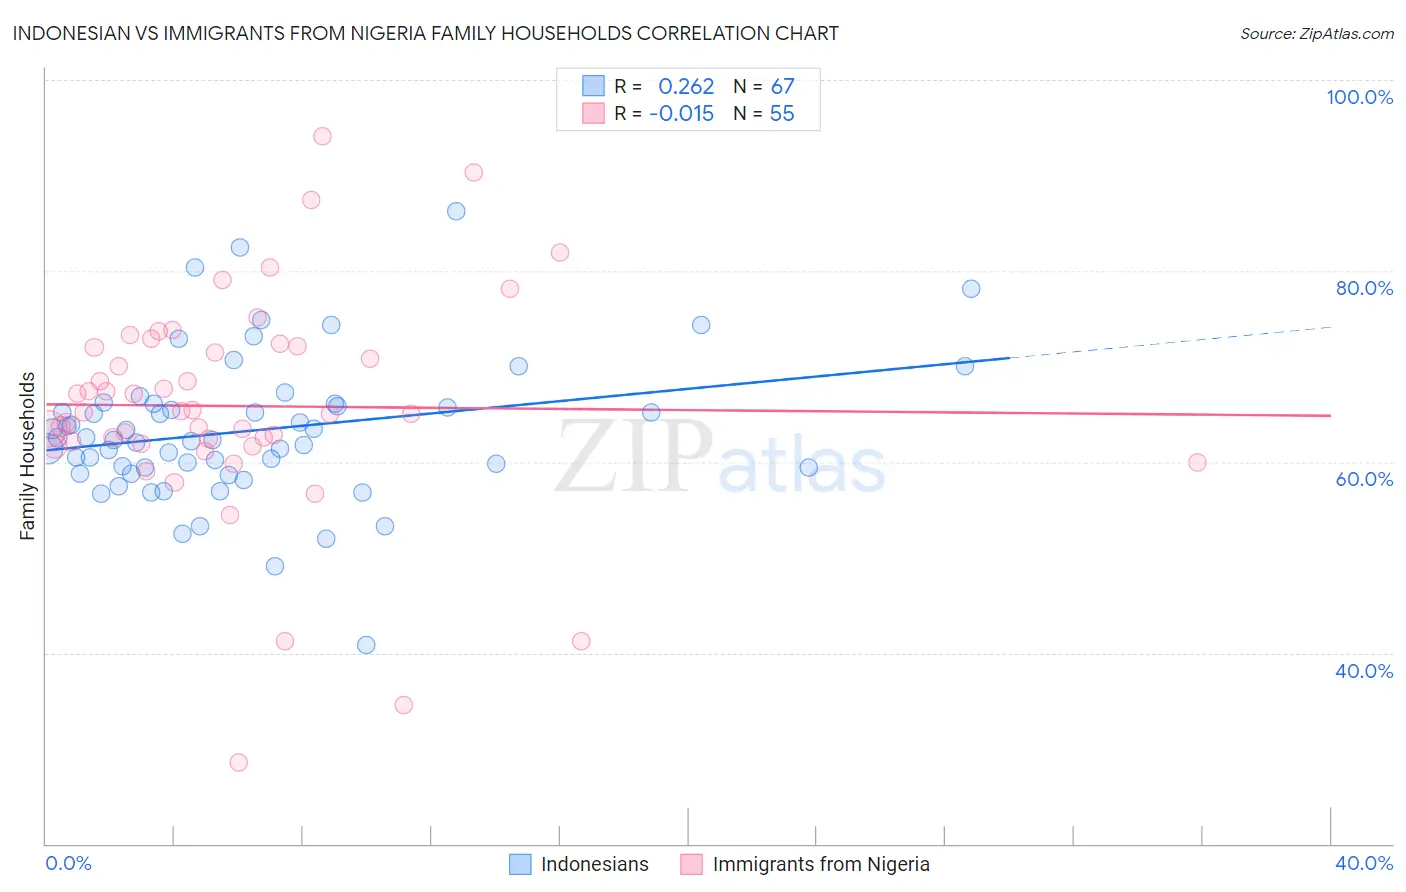
Indonesian vs Immigrants from Nigeria Family Households Correlation Chart
The statistical analysis conducted on geographies consisting of 162,647,758 people shows a weak positive correlation between the proportion of Indonesians and percentage of family households in the United States with a correlation coefficient (R) of 0.262 and weighted average of 61.5%. Similarly, the statistical analysis conducted on geographies consisting of 283,303,761 people shows no correlation between the proportion of Immigrants from Nigeria and percentage of family households in the United States with a correlation coefficient (R) of -0.015 and weighted average of 64.4%, a difference of 4.7%.
Family Households Correlation Summary
| Measurement | Indonesian | Immigrants from Nigeria |
| Minimum | 40.9% | 28.6% |
| Maximum | 86.2% | 94.1% |
| Range | 45.3% | 65.6% |
| Mean | 63.3% | 65.9% |
| Median | 62.3% | 65.1% |
| Interquartile 25% (IQ1) | 59.4% | 61.8% |
| Interquartile 75% (IQ3) | 66.1% | 72.1% |
| Interquartile Range (IQR) | 6.7% | 10.2% |
| Standard Deviation (Sample) | 7.6% | 11.7% |
| Standard Deviation (Population) | 7.6% | 11.6% |
Similar Demographics by Family Households
Demographics Similar to Indonesians by Family Households
In terms of family households, the demographic groups most similar to Indonesians are Black/African American (61.5%, a difference of 0.020%), Kiowa (61.4%, a difference of 0.15%), Cambodian (61.4%, a difference of 0.18%), Immigrants from Switzerland (61.6%, a difference of 0.19%), and Immigrants from West Indies (61.6%, a difference of 0.20%).
| Demographics | Rating | Rank | Family Households |
| Cape Verdeans | 0.0 /100 | #319 | Tragic 61.8% |
| Ugandans | 0.0 /100 | #320 | Tragic 61.7% |
| Alsatians | 0.0 /100 | #321 | Tragic 61.7% |
| Immigrants | Serbia | 0.0 /100 | #322 | Tragic 61.6% |
| Tlingit-Haida | 0.0 /100 | #323 | Tragic 61.6% |
| Immigrants | West Indies | 0.0 /100 | #324 | Tragic 61.6% |
| Immigrants | Switzerland | 0.0 /100 | #325 | Tragic 61.6% |
| Indonesians | 0.0 /100 | #326 | Tragic 61.5% |
| Blacks/African Americans | 0.0 /100 | #327 | Tragic 61.5% |
| Kiowa | 0.0 /100 | #328 | Tragic 61.4% |
| Cambodians | 0.0 /100 | #329 | Tragic 61.4% |
| Immigrants | Australia | 0.0 /100 | #330 | Tragic 61.3% |
| Immigrants | France | 0.0 /100 | #331 | Tragic 61.3% |
| Ethiopians | 0.0 /100 | #332 | Tragic 61.2% |
| Immigrants | Ethiopia | 0.0 /100 | #333 | Tragic 61.2% |
Demographics Similar to Immigrants from Nigeria by Family Households
In terms of family households, the demographic groups most similar to Immigrants from Nigeria are Immigrants from Southern Europe (64.4%, a difference of 0.0%), Scotch-Irish (64.4%, a difference of 0.010%), British (64.4%, a difference of 0.020%), Chickasaw (64.4%, a difference of 0.020%), and Irish (64.4%, a difference of 0.030%).
| Demographics | Rating | Rank | Family Households |
| Canadians | 66.6 /100 | #157 | Good 64.4% |
| Lebanese | 66.4 /100 | #158 | Good 64.4% |
| Germans | 65.8 /100 | #159 | Good 64.4% |
| Immigrants | Moldova | 65.2 /100 | #160 | Good 64.4% |
| Immigrants | England | 62.6 /100 | #161 | Good 64.4% |
| British | 61.6 /100 | #162 | Good 64.4% |
| Chickasaw | 61.5 /100 | #163 | Good 64.4% |
| Immigrants | Nigeria | 60.1 /100 | #164 | Good 64.4% |
| Immigrants | Southern Europe | 60.0 /100 | #165 | Good 64.4% |
| Scotch-Irish | 59.2 /100 | #166 | Average 64.4% |
| Irish | 57.9 /100 | #167 | Average 64.4% |
| Hondurans | 57.5 /100 | #168 | Average 64.4% |
| Iraqis | 56.0 /100 | #169 | Average 64.4% |
| Armenians | 55.9 /100 | #170 | Average 64.4% |
| Ute | 54.6 /100 | #171 | Average 64.3% |